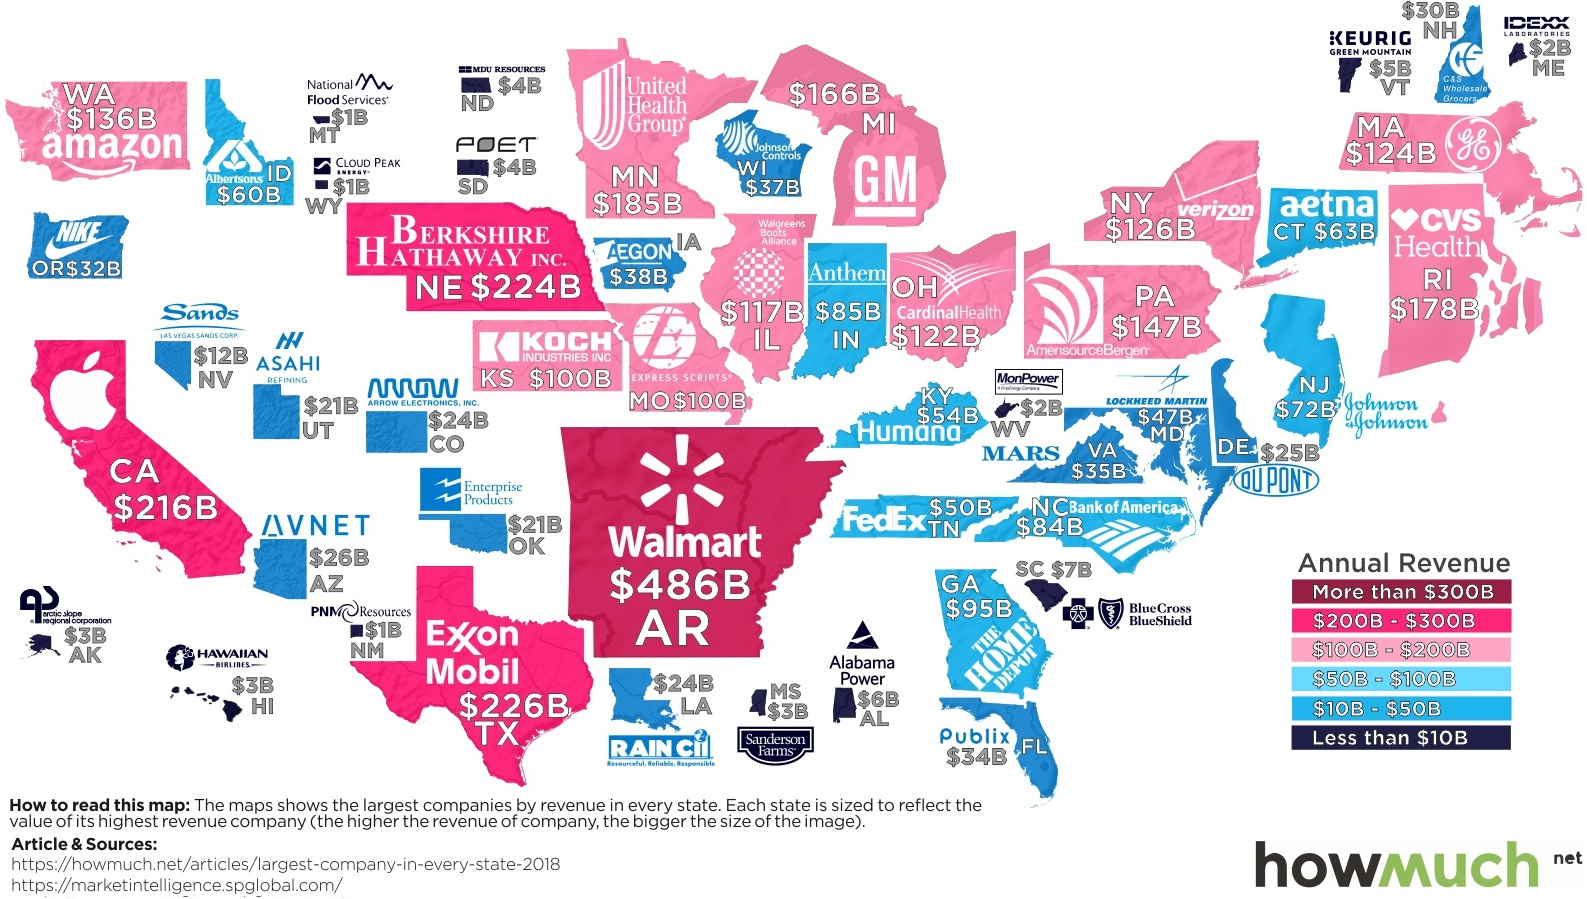
From Walmart ($486B) to companies a tiny fraction of the size, here is a map showing the largest company in every state by revenue.
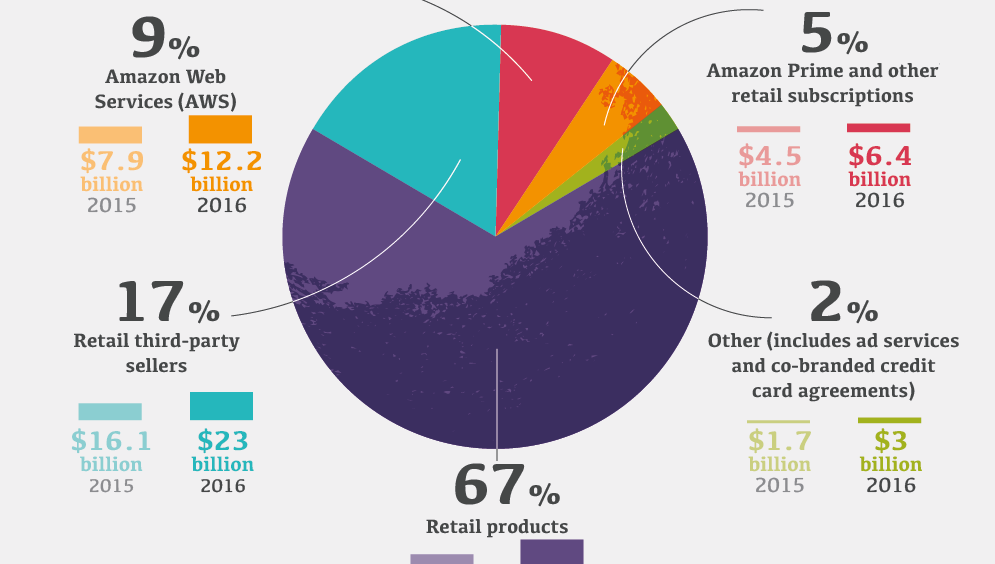
This infographic dives deep into the company's focus on customers, as well as its massive growth. In addition, it breaks down how Amazon makes money.
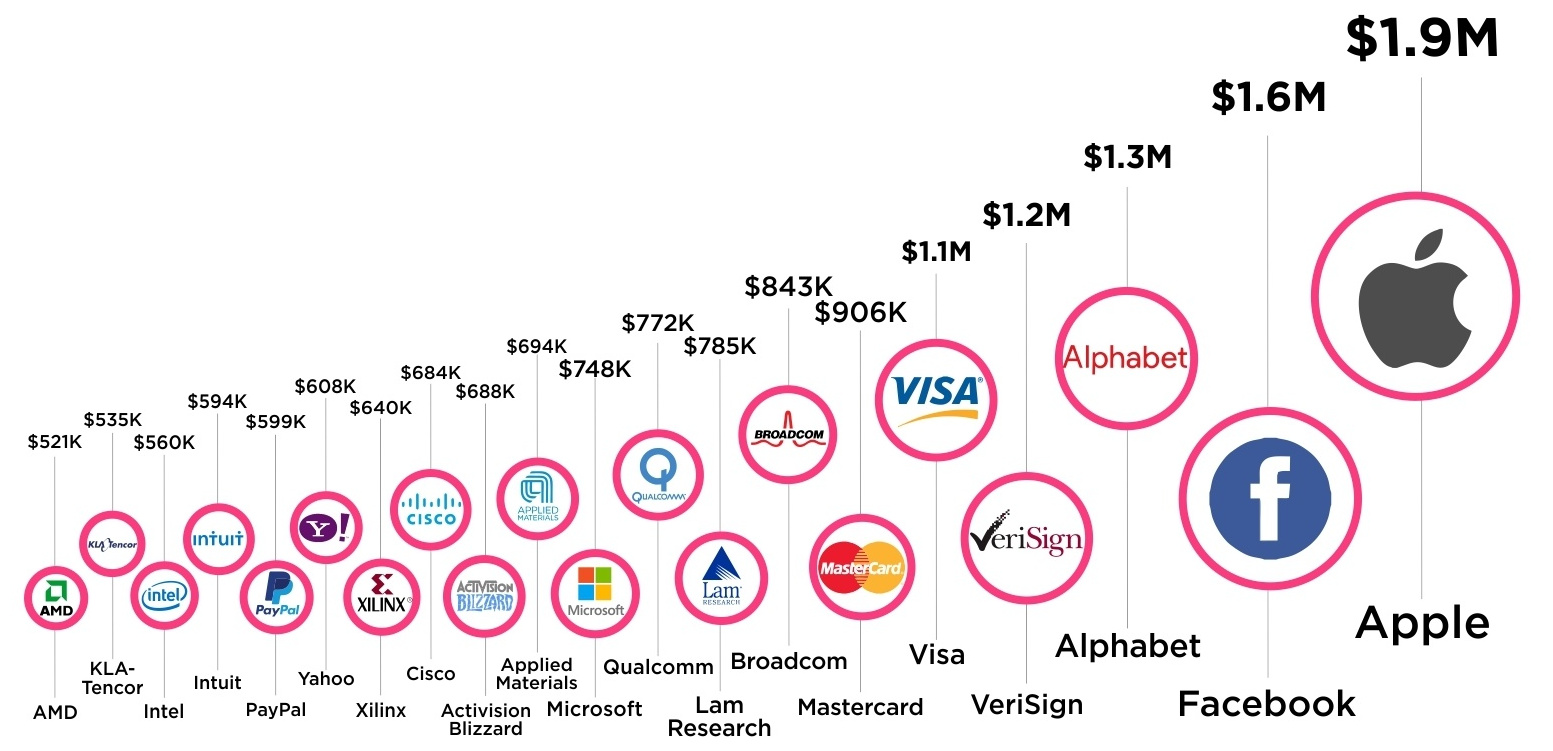
Here's how much tech companies make per person on staff - Apple, Facebook, and Alphabet all make well over $1 million in revenue per employee.
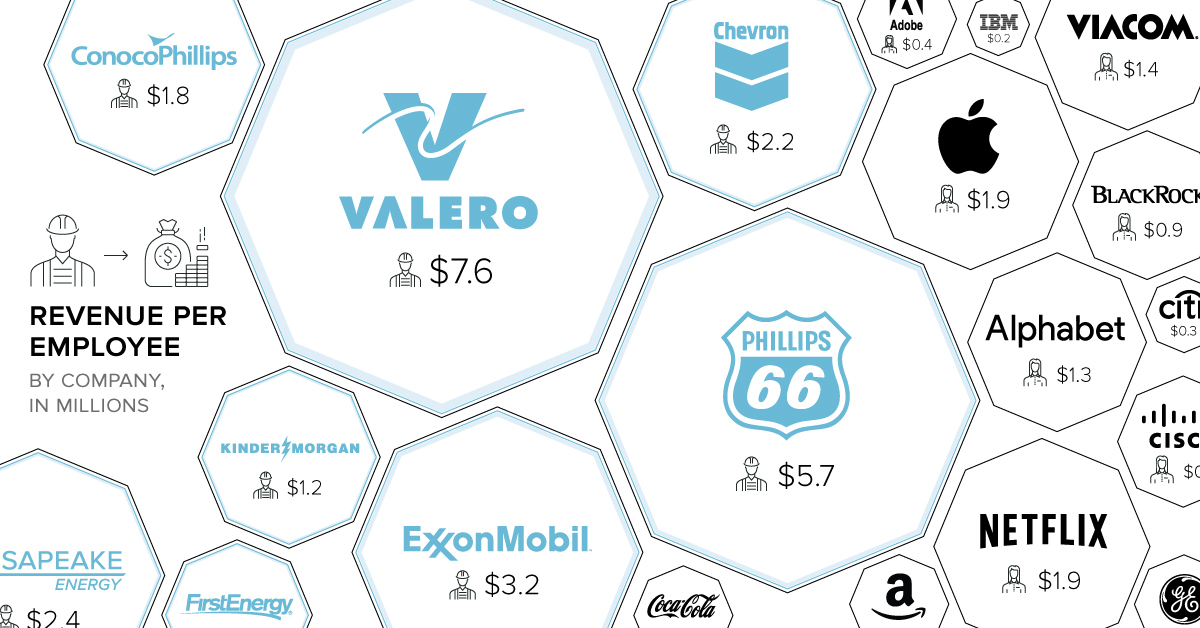
When it comes to revenue per employee, energy companies dominate. On average, oil companies bring in 2x more per employee than companies in other sectors.

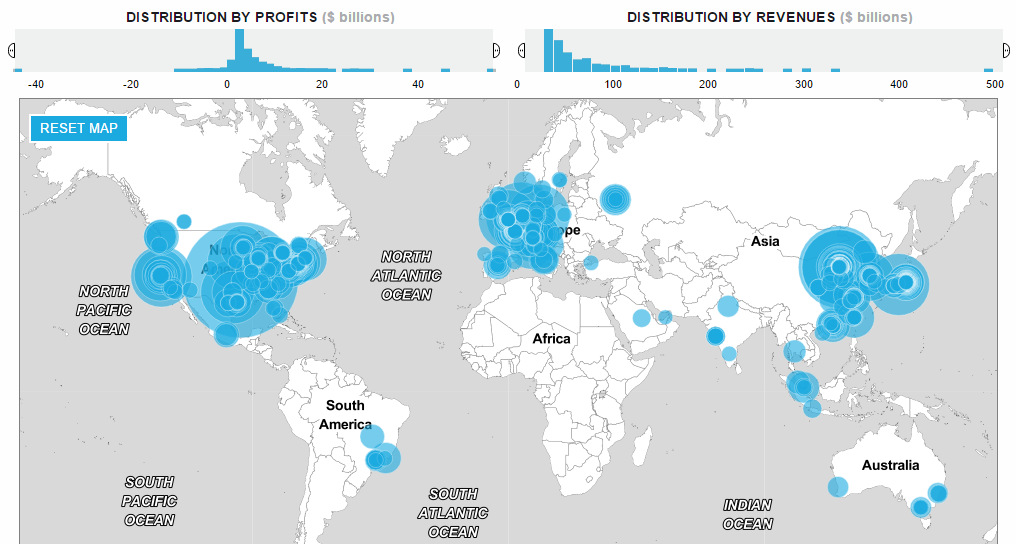
This data visualization compares the revenue and profit numbers for the top 100 companies by market valuation in the world.
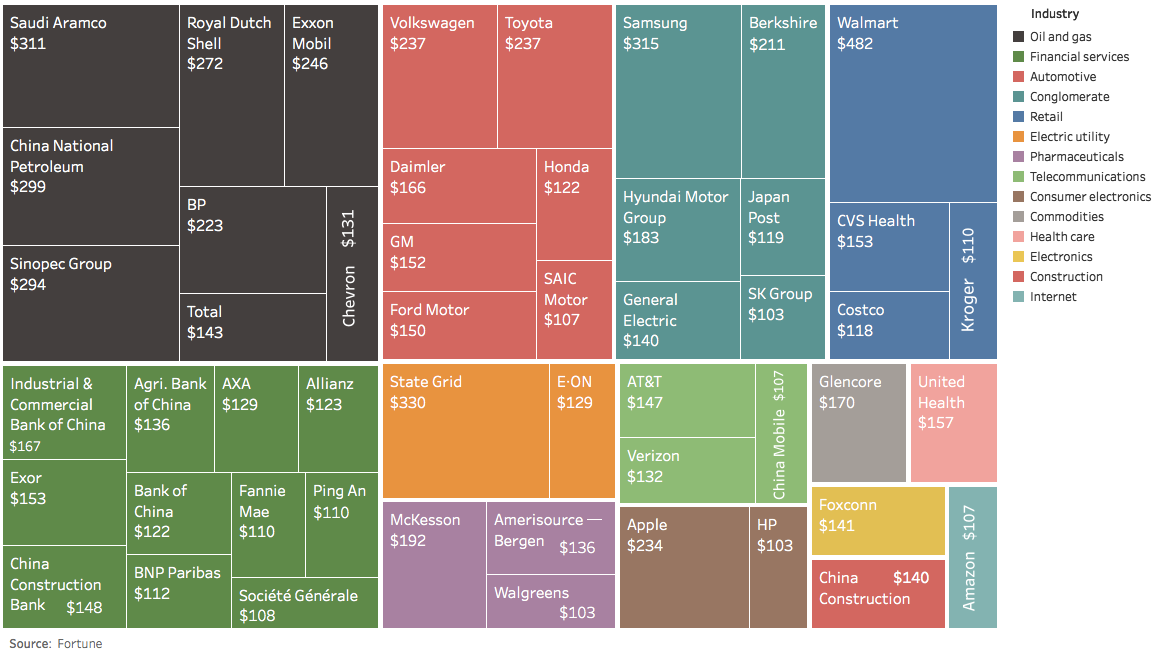
The usual oil companies and banks dominate the list of the largest 50 companies by revenue - but there are also some lesser knowns worth learning...
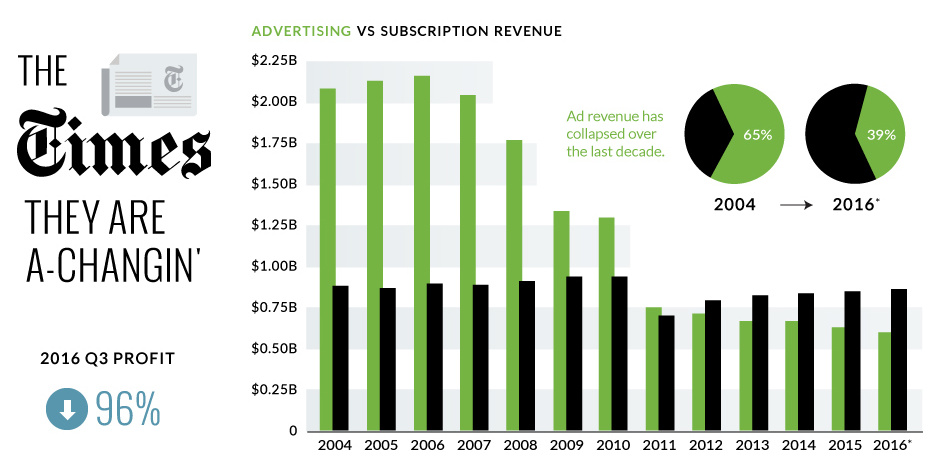
The New York Times just announced a 95.7% decrease in quarterly profits - we look at the numbers and context around the NYT's digital transition.
How has the list of the world's largest companies by revenue changed over the last 20 years? See the rise and fall of the companies on...

More time is spent on Snapchat than almost any other app. However, investors are getting antsy about the emerging Snapchat monetization problem.
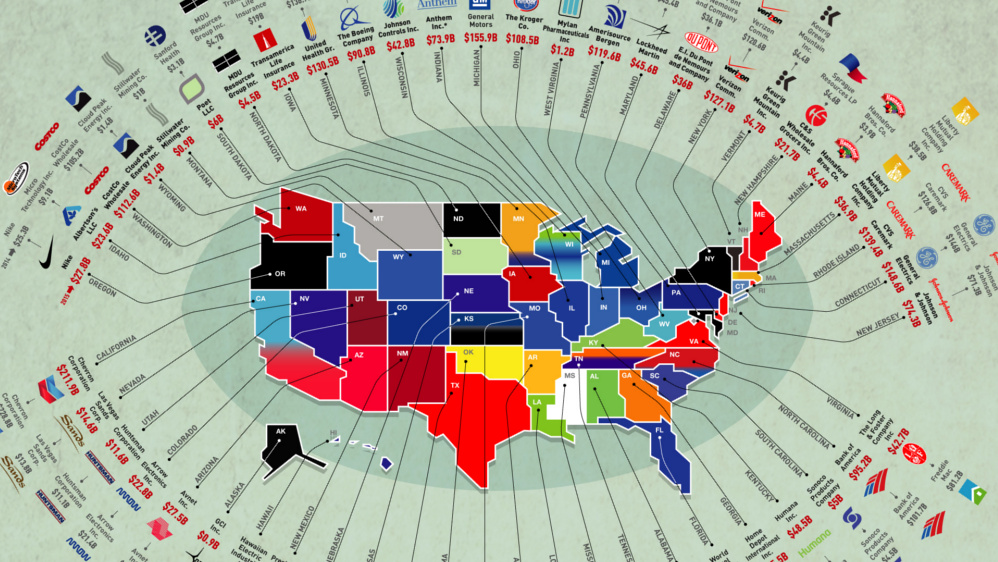
The biggest businesses in the U.S. range from oil producers to retail giants. Here's a list showing the largest company in each state by revenue.


