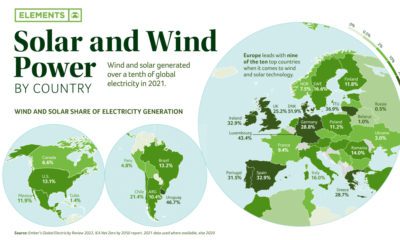

Wind and solar make up 10% of the world’s electricity. Combined, they are the fourth-largest source of electricity after coal, gas, and hydro.
The current energy transition is unprecedented in both scale and speed. This infographic puts it into historical context.
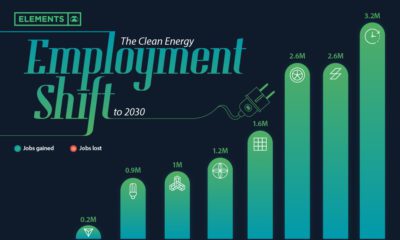

Will the clean energy transition create jobs, or will jobs be lost? Here is projected employment growth in clean energy and related sectors to 2030.
Global energy transition investment hit $755 billion in 2021. This chart ranks the top 10 countries by energy transition investment.
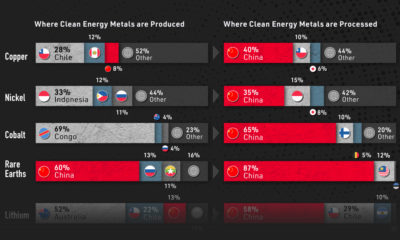

Despite being the world's biggest carbon emitter, China is also a key producer of most of the critical minerals for the green revolution.
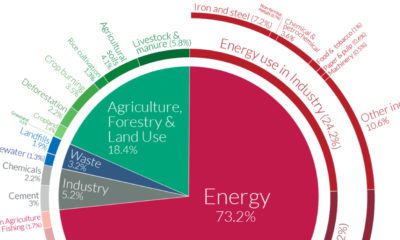

A Global Breakdown of Greenhouse Gas Emissions by Sector In a few decades, greenhouse gases (GHGs)—chiefly in the form of CO₂ emissions—have risen at unprecedented rates...


In 2020, solar power saw its largest-ever annual capacity expansion at 127 gigawatts. Here's a snapshot of solar power capacity by country.
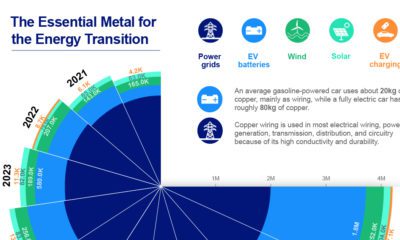

Global copper demand for alternative energy sources is expected to jump from 2.1 million tonnes in 2020 to 4.3 million tonnes in 2030.
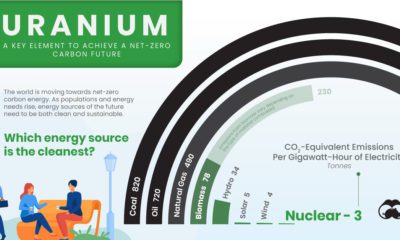

All energy sources have negative impacts, but some are better for the environment than others. Which energy source is the cleanest?
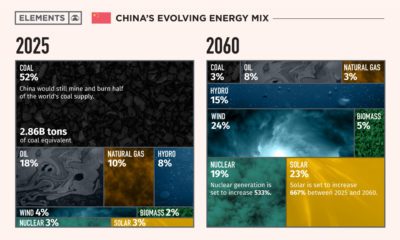

This infographic takes a look at what China's energy transition plans are to make its energy mix carbon neutral by 2060.


 Creator Program