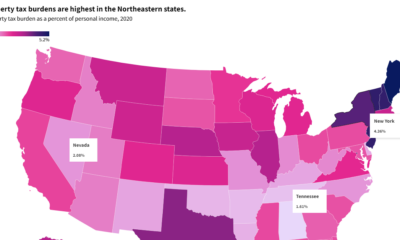

This interactive graphic shows property taxes by state in the U.S. as a percentage of personal income in 2020.


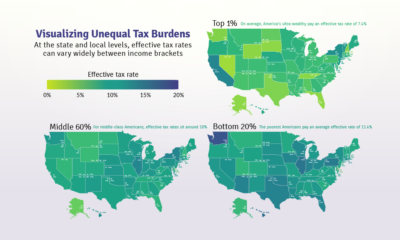
Poor families pay a higher share of their income towards state and local taxes than wealthy families. These maps show the inequitable tax burdens.