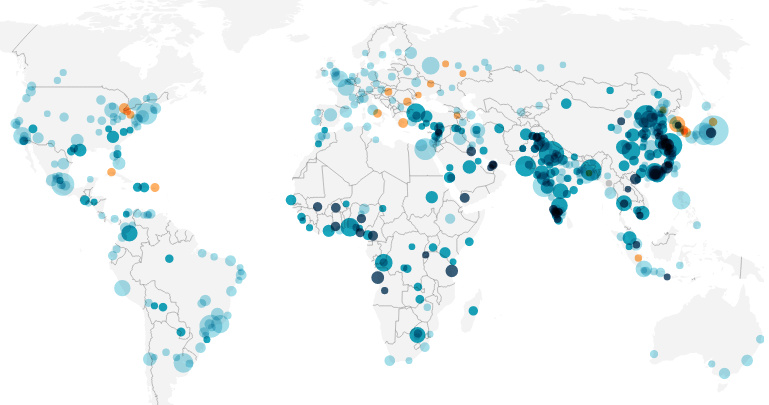
Interactive map showing 500 cities with over 1M+ inhabitants, sorted by growth rate from 2000-2016. Use it to find the fastest growing cities in the world.
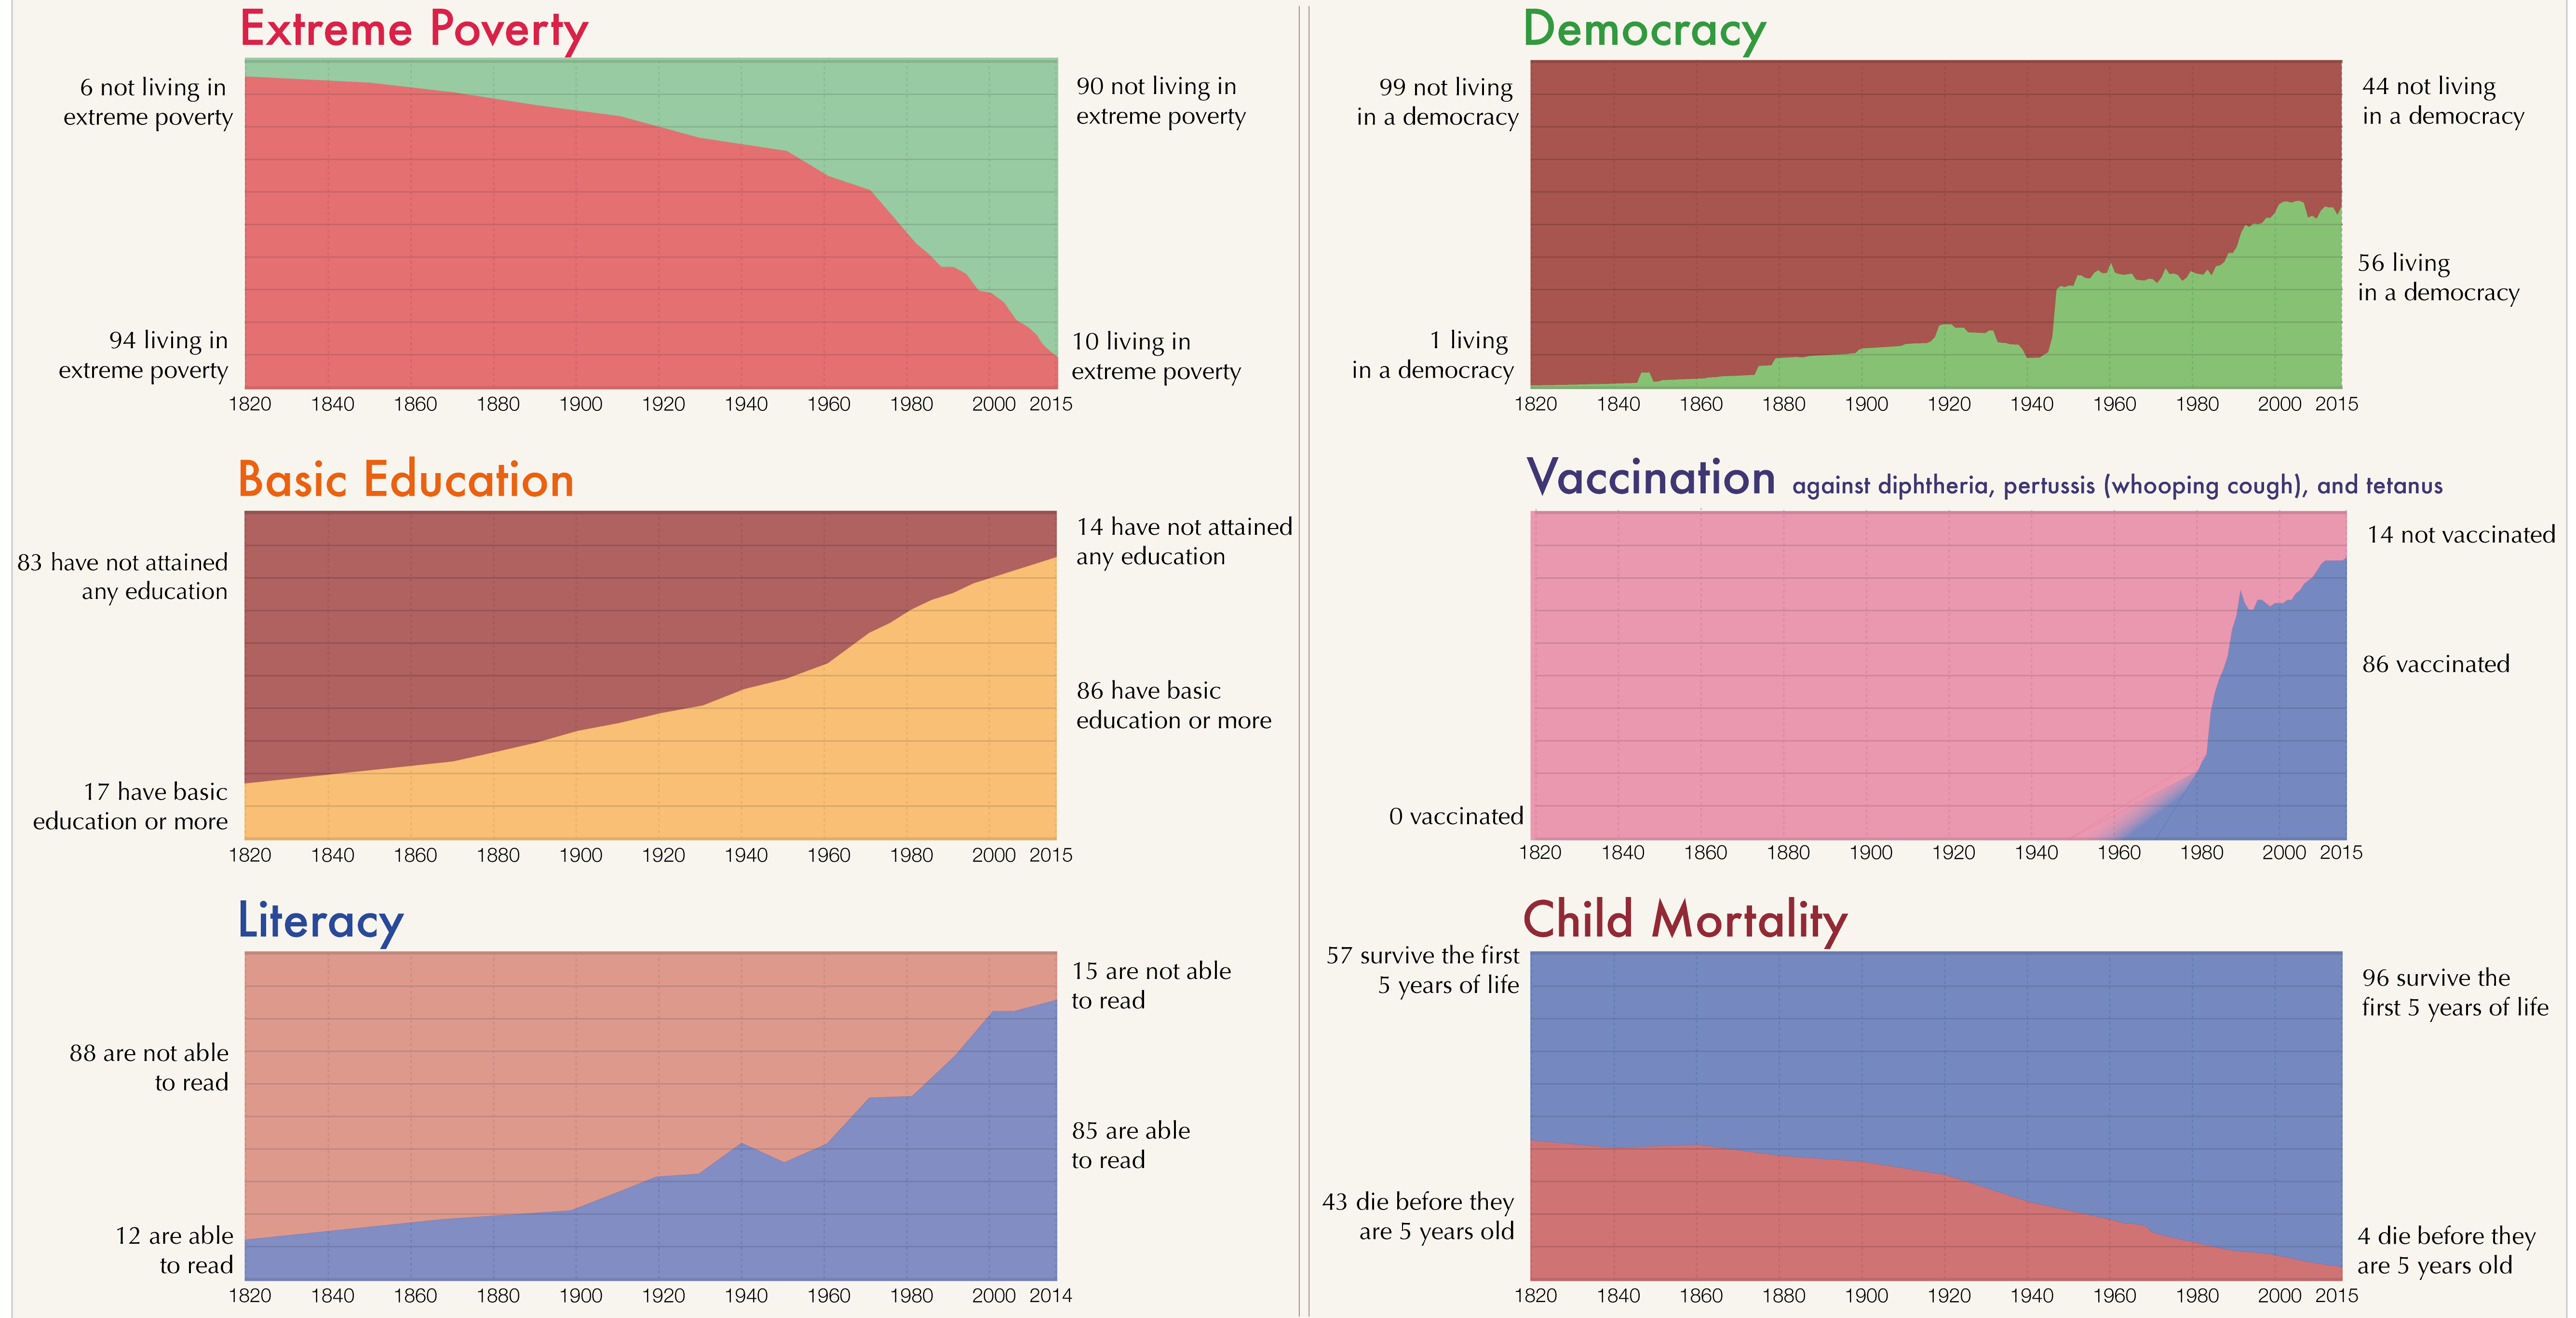
Long-term trends really allow you to see human progress on the most important indicators, like poverty reduction, education, democracy, literacy, and health.
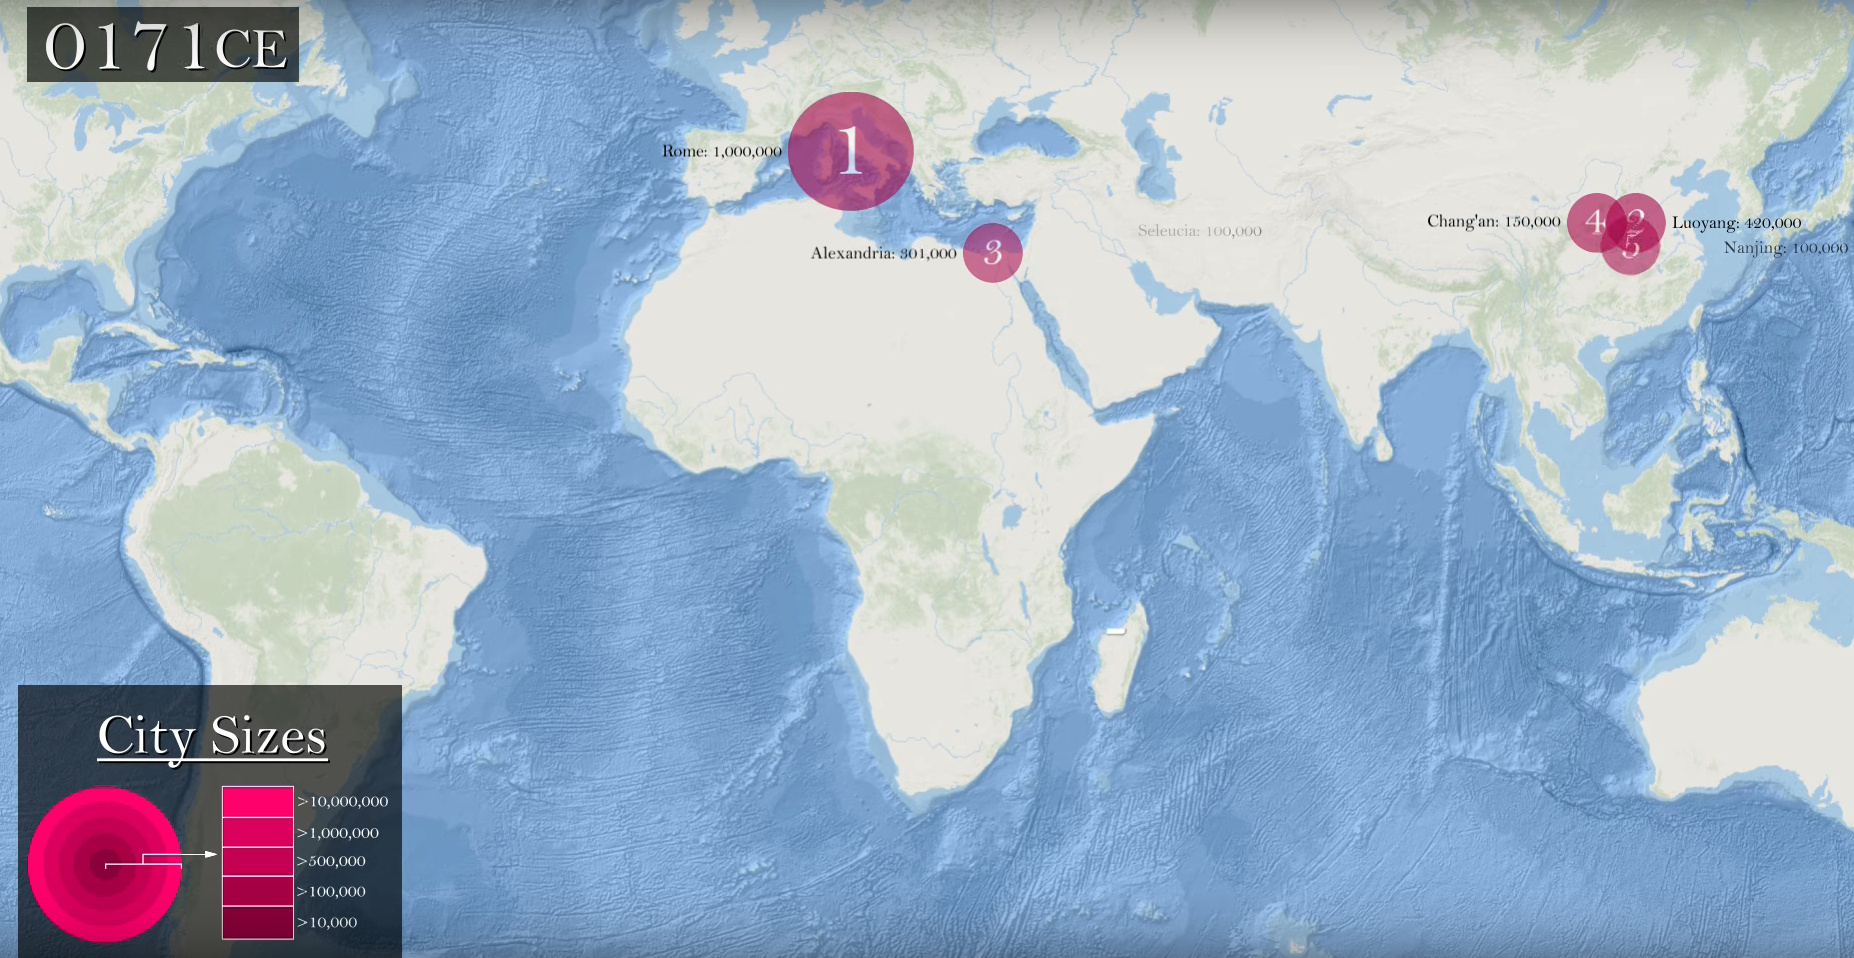
See how the list of the world's five largest cities has changed between 3000 BC until today, and how it's expected to shift as we close...
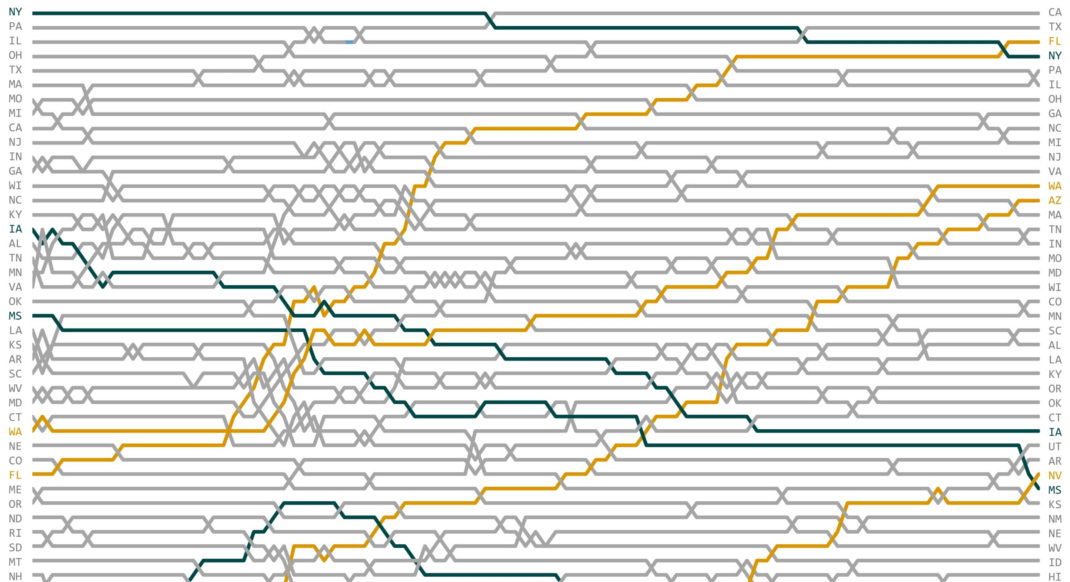
How have state populations changed over a century? This bump chart shows the population rank of every state in the United States over 1917-2017.
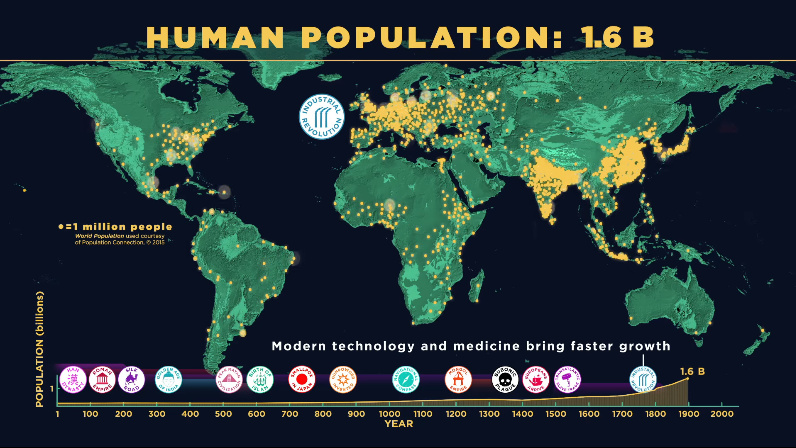
This animation captures 200,000 years of human population growth - see everything from the invention of farming to the impact of the Black Death.
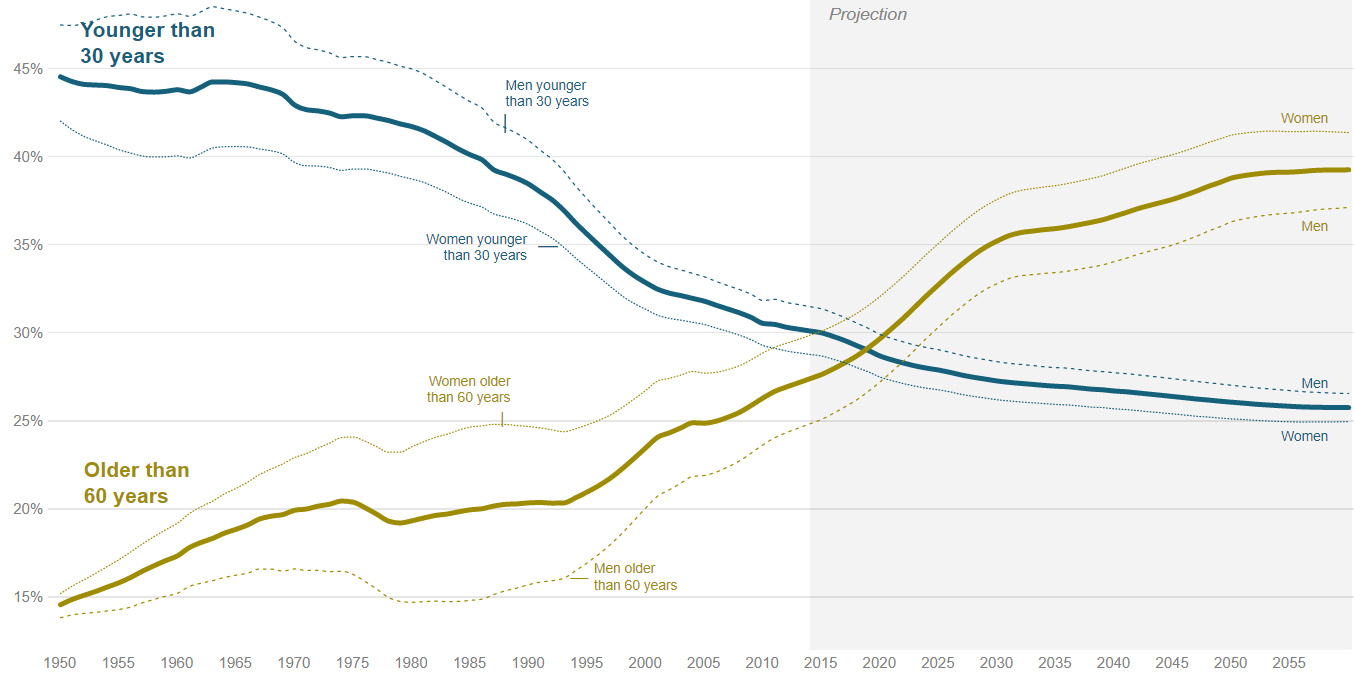
By 2019, the country will have a higher 60+ year old population than its 30 and under crowd. This series of charts shows the demographic outlook...
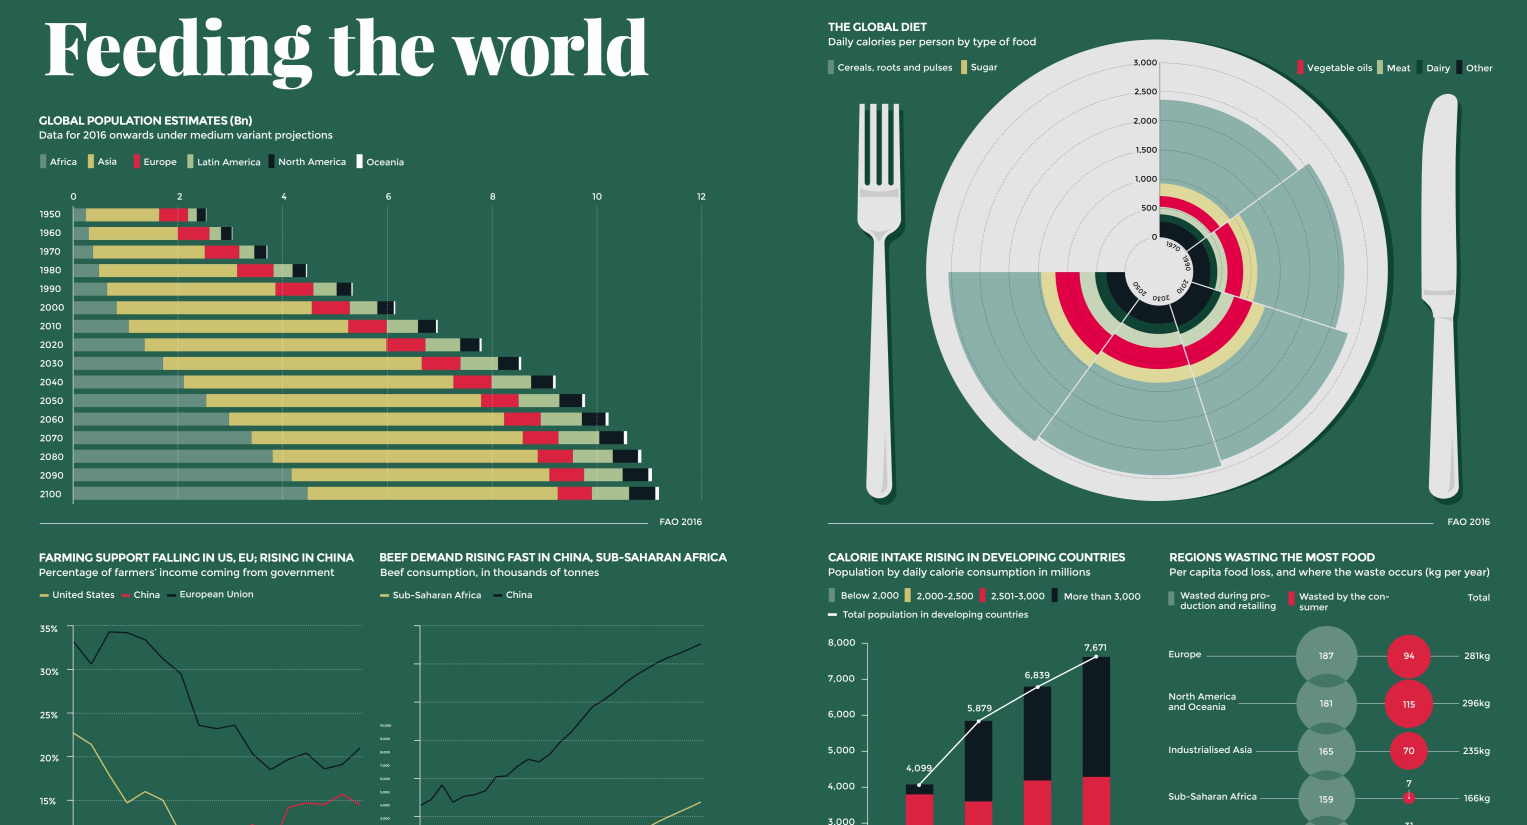
The global population will grow by billions in the coming years - but more importantly, the global diet is changing rapidly, as well.
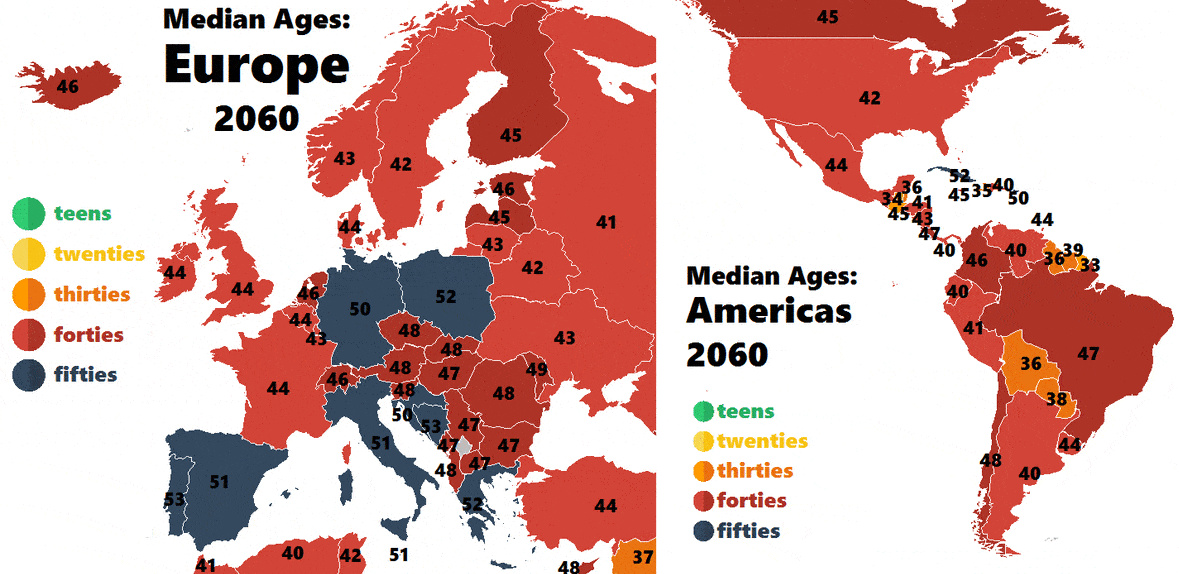
How fast are countries in Europe and the Americas aging? These colorful animations show how the median age is projected to change up until the year...
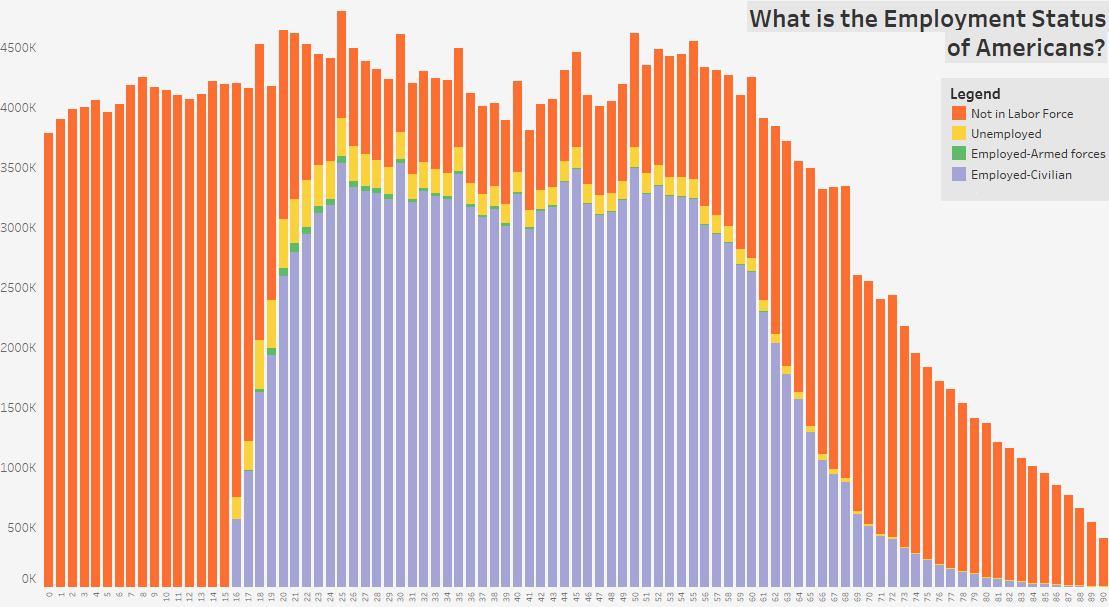
These three charts show the age distribution of the U.S. population, further broken down by employment status, education, and marital status.
The world's 10 most populous countries may all have many millions of people, but their future growth prospects are very different.


