

This table shows the fluctuating returns for various commodities over the past decade, from energy fuels to industrial and precious metals.
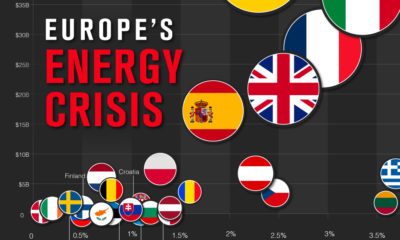

As European gas prices soar, countries are introducing policies to try and curb the energy crisis.
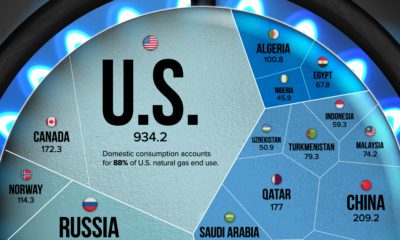

Natural gas prices have risen since Russia's invasion of Ukraine. This visualization highlights the world’s largest natural gas producers.
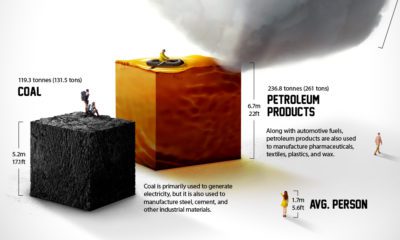

Each year the average American consumes more than 23 barrels of petroleum products. What does a lifetime of fossil fuel consumption look like?
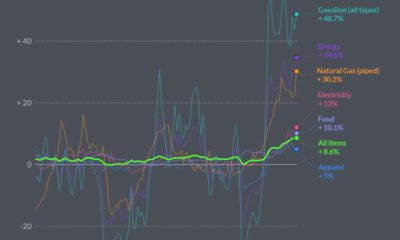

In May 2022, U.S. Inflation was the highest its been since 1981. Here’s a look at which products saw the biggest price jumps.
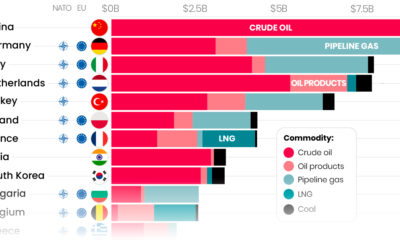

Here are the top importers of Russian fossil fuels since the start of the war.
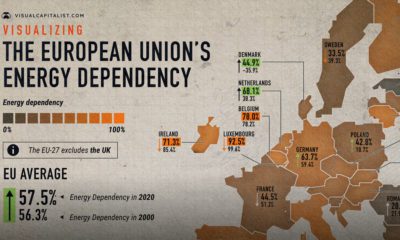

The EU's energy dependency has become a major issue amid Russia's invasion of Ukraine. See what the data says in this infographic.
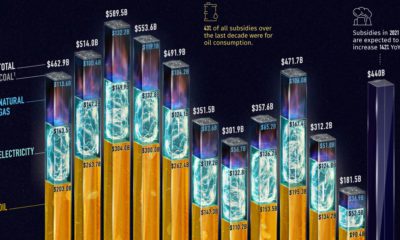

Governments pour nearly $500 billion into fossil fuel subsidies annually. This chart breaks down fossil fuel subsidies between 2010 and 2021.
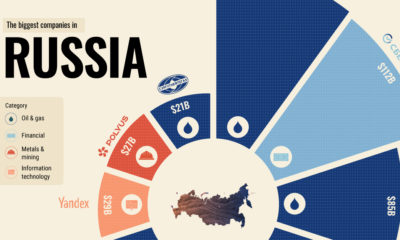

Here are the top 10 biggest companies in Russia, the largest country in the world.
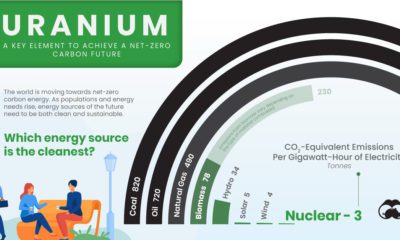

All energy sources have negative impacts, but some are better for the environment than others. Which energy source is the cleanest?


 Creator Program