

Visualizing the vast amount of data produced every single minute, and why it's still early days in the big data era of technology.

This month marked the 30th birthday of the World Wide Web. Here are the events that shaped it over the course of its history.


In every internet minute, there is an extraordinary amount of activity. Wrap your head around it all with this nifty infographic.


This in-depth infographic provides a practical guide on how anyone can increase privacy on their browser, social media networks, and mobile device.
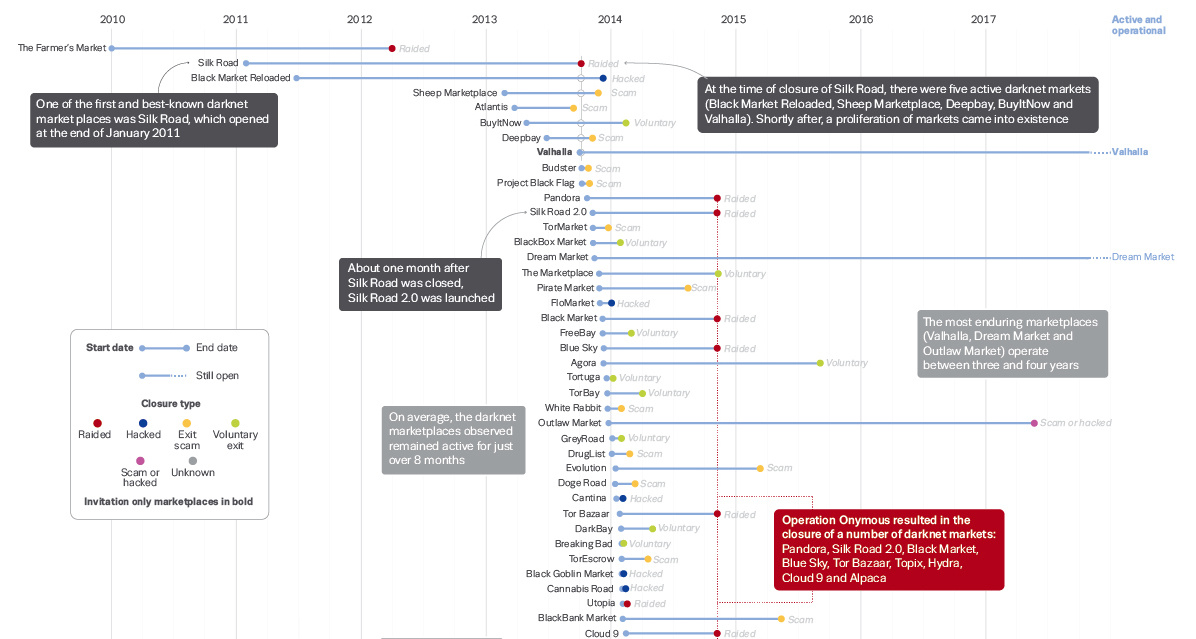
How often does a dark web marketplace last, on average? This data visualization offers a data-driven look at the survival rate of underground marketplaces.
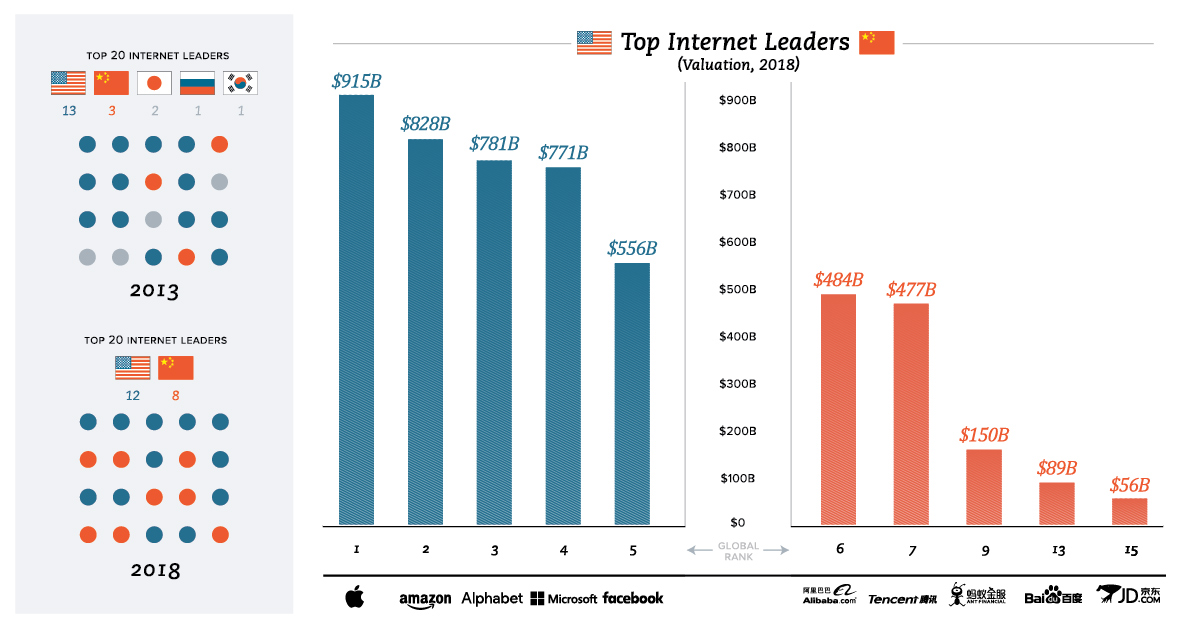
A total of 12 of the largest tech giants come from the United States, while eight hail from China. All other countries combine for zero.
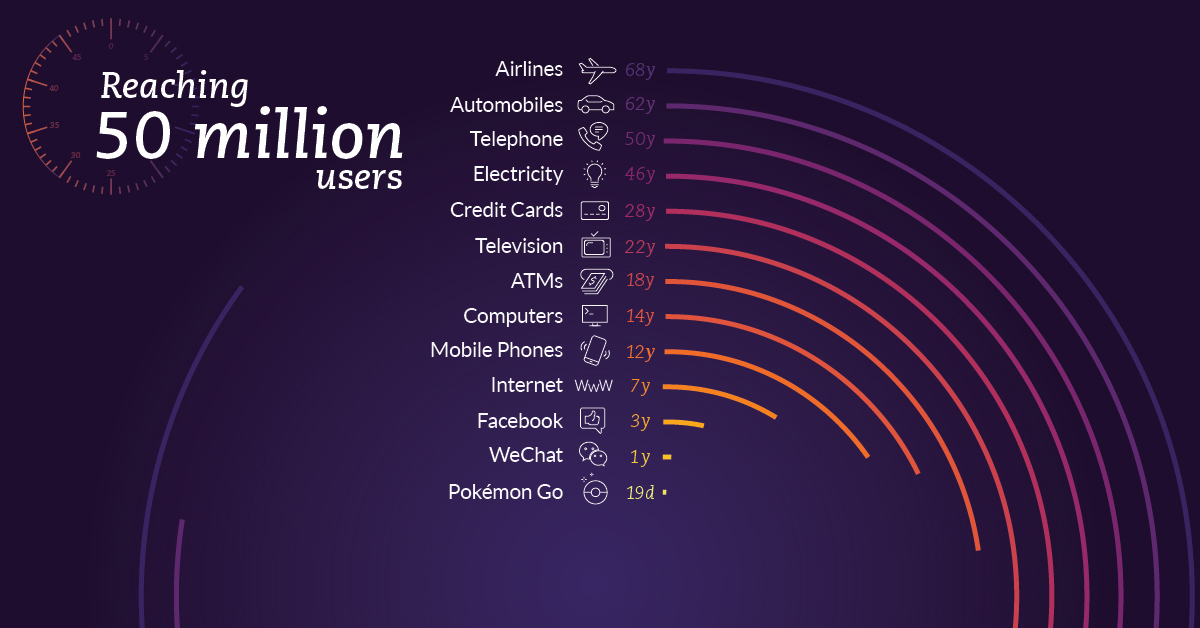
It used to take decades to accumulate 50 million users for a new product, but now it can be done in just days thanks to the...
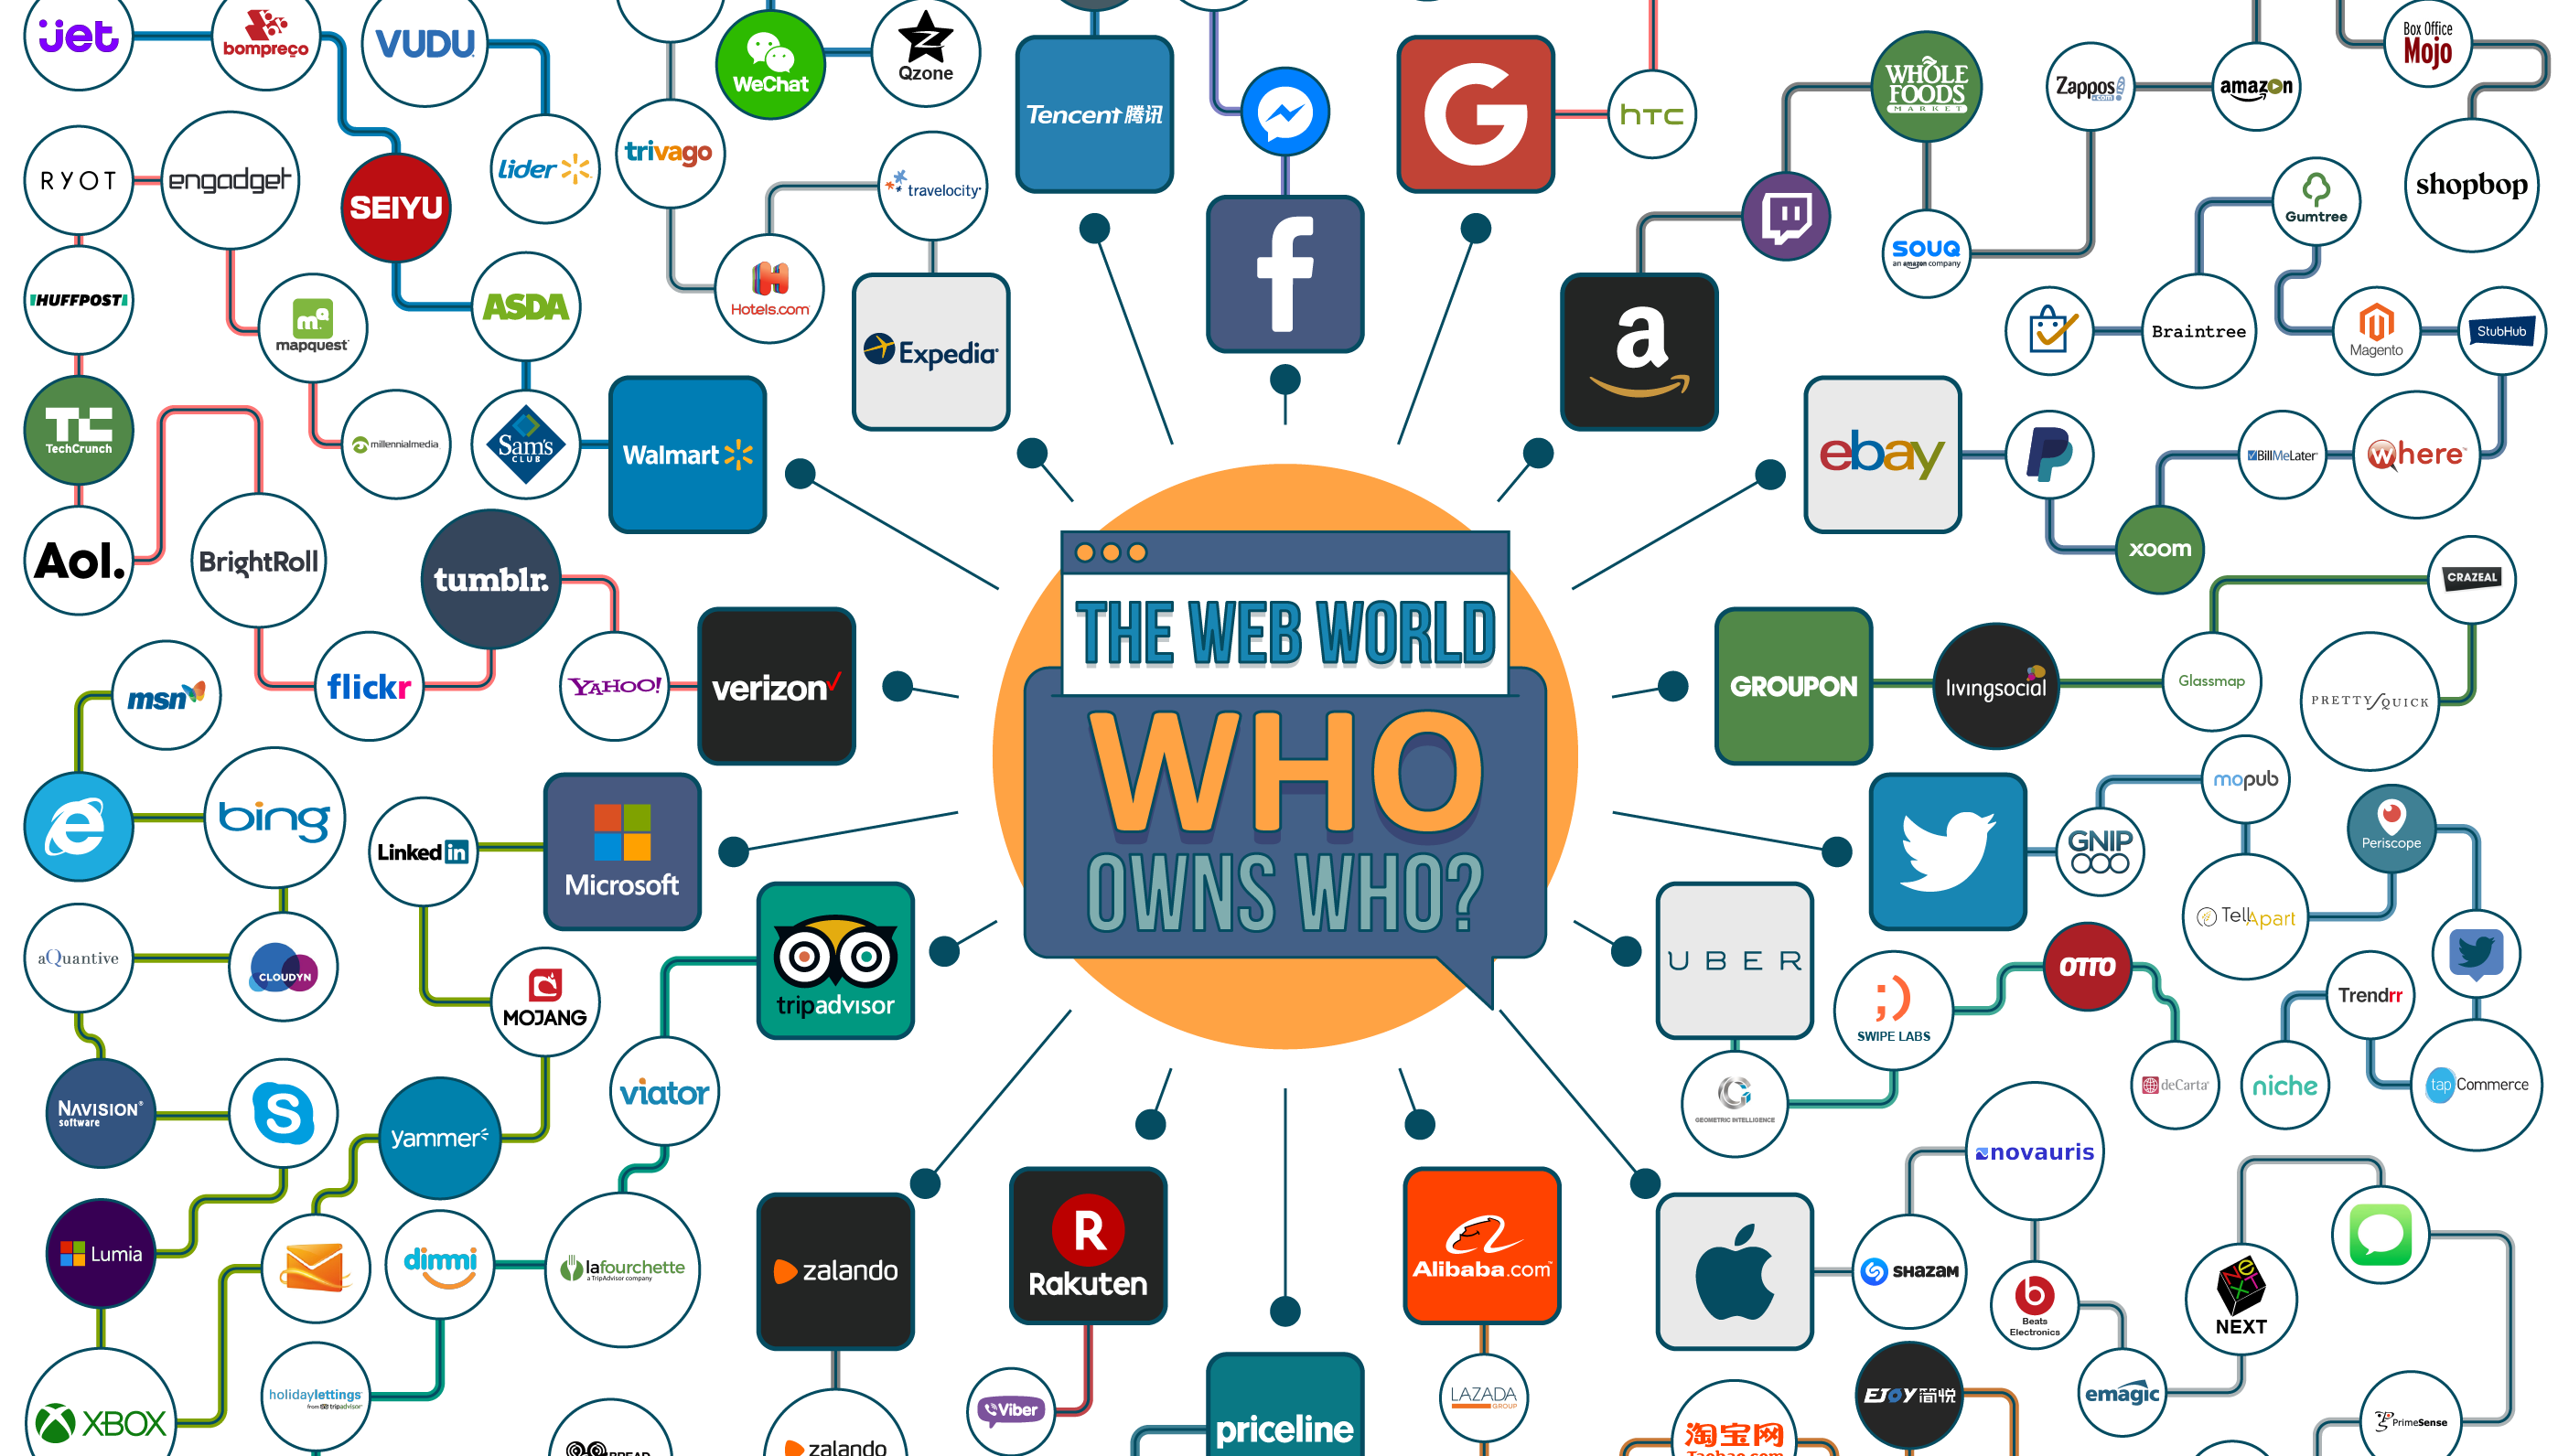
The tech world is becoming much more consolidated. This infographic shows the major entities owned by internet giants like Facebook, Amazon, and Google.
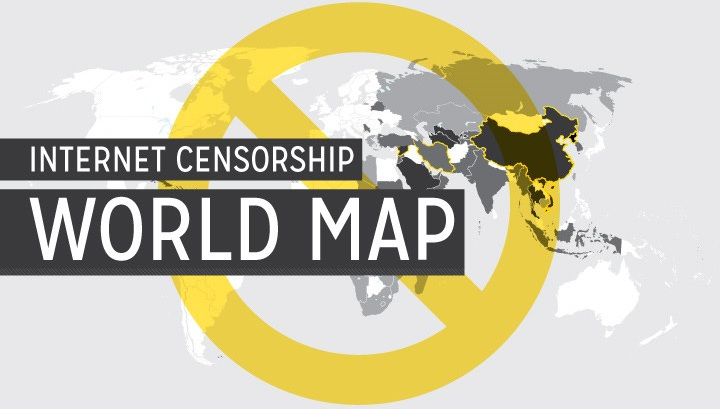
Much of the world’s population surfs an internet that is at least partially censored, and this map shows to which degree that is true for every...
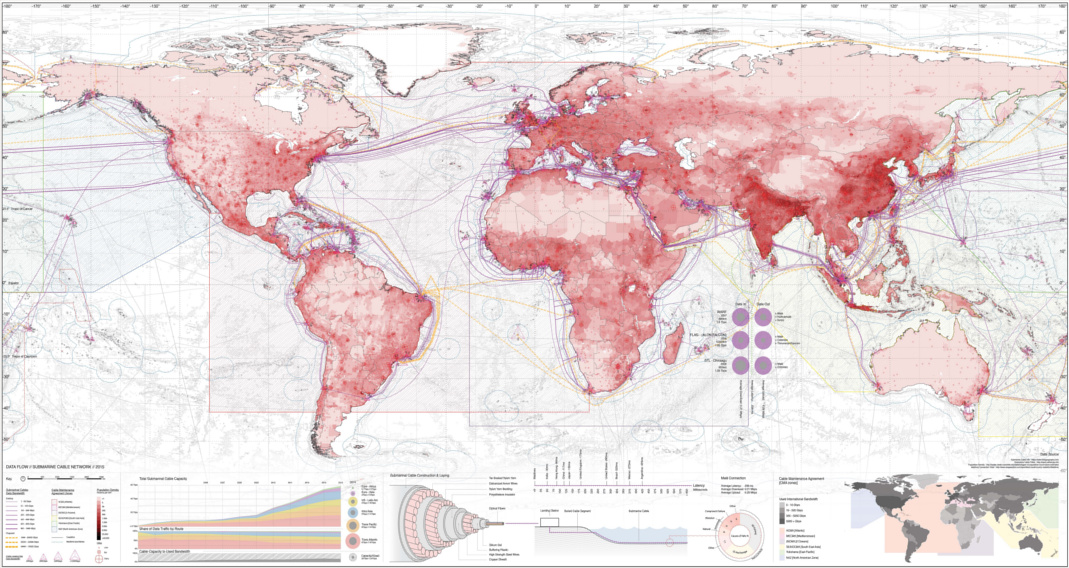
Satellites get all the glory, but 99% of the world's data actually flows through a vast network of fiber optic submarine cables.


