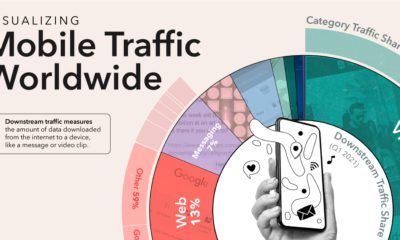

Of the millions of apps available around the world, just a small handful of the most used apps dominate global internet traffic.


Online shopping has evolved rapidly over the last few decades ago. Here’s a look at how much it's evolved since its emergence in the late 70s.
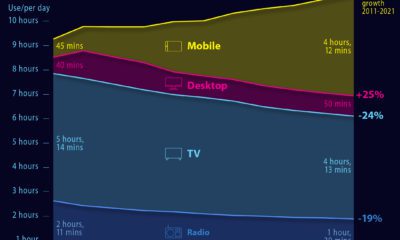

The media consumption landscape in 2021 is shifting. Time spent on media continues to spike, with mobile challenging for the top spot
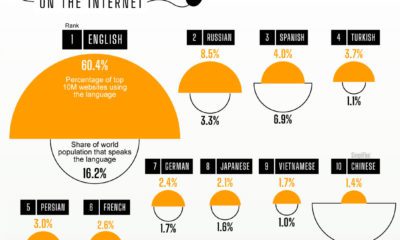

The internet is a truly global phenomenon, but a handful of languages dominate the digital world. Over 60% of the top 10 million webpages feature content...
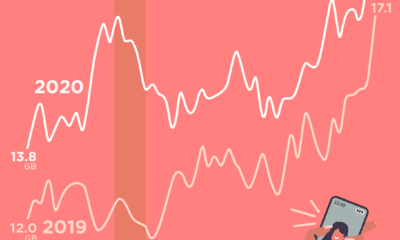

Data usage across America peaked in April 2020, but reached relatively normal levels by the end of the year.
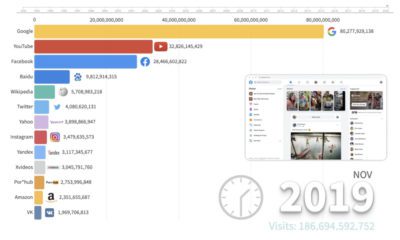

This animation provides an interesting overview of the websites with the highest traffic over the last few decades, and how the rankings have changed.
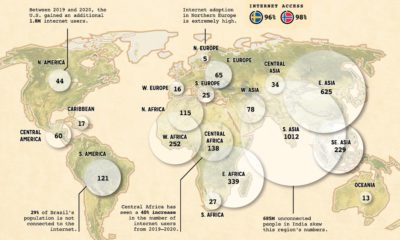

When it comes to worldwide internet use, which regions are the most disconnected? And which regions have the most opportunity for growth?
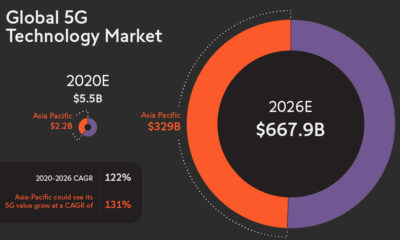

With the imminent 5G revolution, total connectivity could be at our fingertips. This graphic looks at its far-reaching IoT applications and potential.
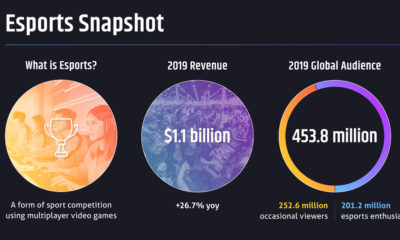

Telcos failed to capitalize on the 'Netflix' opportunity — however, the birth of a new multi-billion dollar industry (esports) could change the game.
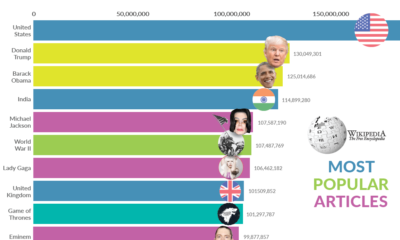

Millions flock to Wikipedia every day to satisfy their curiosity on every imaginable topic. What have been the most popular Wikipedia pages over time?