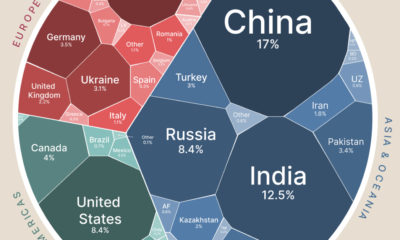

Global wheat production is concentrated in just a handful of countries. Here’s a look at the top wheat-producing countries worldwide.
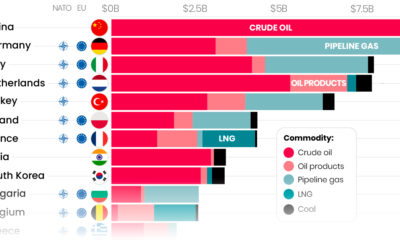

Here are the top importers of Russian fossil fuels since the start of the war.
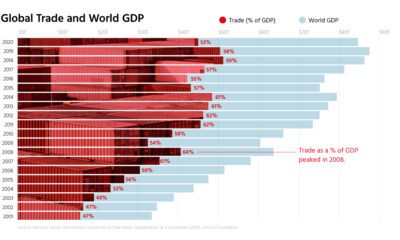

Free trade is a powerful engine for economic growth, but rising protectionism stands in the way. See what the data says in this infographic.
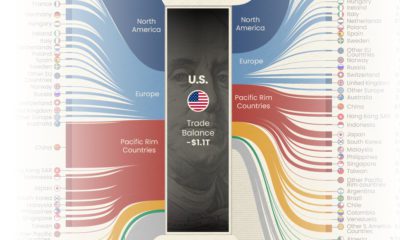

U.S. trade of goods amounted to nearly $4.6 trillion in 2021, and Canada, Mexico, and China were the country's biggest trading partners.

This visualization breaks down U.S. oil imports by country for 2021, showing the split by OPEC and non-OPEC nations.

The EU's energy dependency has become a major issue amid Russia's invasion of Ukraine. See what the data says in this infographic.

This graphic visualizes Ukraine's top international trading partners and the country's most exported and imported products in 2020.


The world's biggest pharmaceutical companies are worth $4.1 trillion. Here we map the top 100 companies based on their market cap value.

The UK and the EU have recently laid out new terms for their relationship. So how important is the UK's trade with the EU?
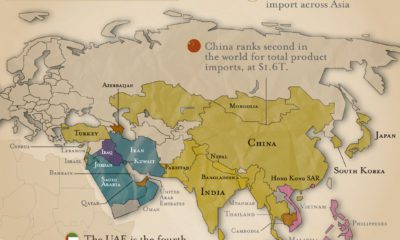

What are the top imports across Asia? Petroleum is the most popular import, followed by vehicles and electronic integrated circuits.