

U.S. debt interest payments have surged past the $1 trillion dollar mark, amid high interest rates and an ever-expanding debt burden.
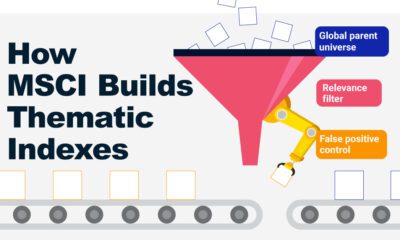

From developing an index objective to choosing relevant stocks, this graphic breaks down how MSCI builds thematic indexes using examples.


This graphic highlights France and Canada as the global leaders when it comes to generating carbon tax revenue.


South Asian nations are the global hotspot for pollution. In this graphic, we rank the world’s most polluted countries according to IQAir.


The earthquake that shook buildings across New York in April 2024 was the third-largest quake in the Northeast U.S. over the past 50 years.


We visualized the top U.S. companies by employees, revealing the massive scale of retailers like Walmart, Target, and Home Depot.
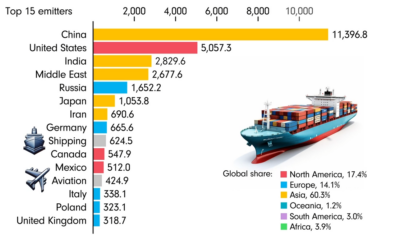

This animated chart by James Eagle uses data from Our World in Data to show the 15 largest carbon emitters between 1850 and 2022.


One country is taking reforestation very seriously, registering more than 400,000 square km of forest growth in two decades.


Firing an advisor is often driven by more than cost and performance factors. Here are the top reasons clients 'break up' with their advisors.


Here are the most common drivers for hiring a financial advisor, revealing that investor motivations go beyond just financial factors.


 Creator Program