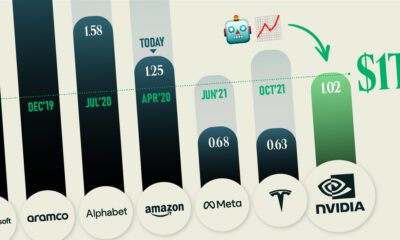

America's biggest chipmaker Nvidia has joined the trillion dollar club as advancements in AI move at lightning speed.
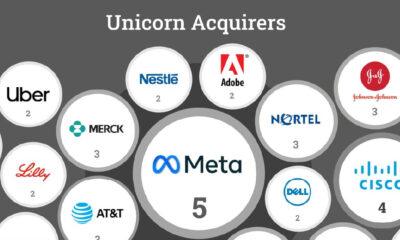

Roughly 30% of unicorns making an exit get acquired. But which companies have made the most U.S. unicorn acquisitions in the last 25 years?
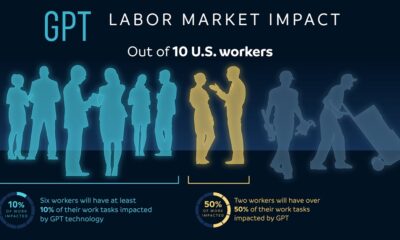

OpenAI, the creators of ChatGPT, have authored a research paper that tries to predict the impact of AI on the job market.
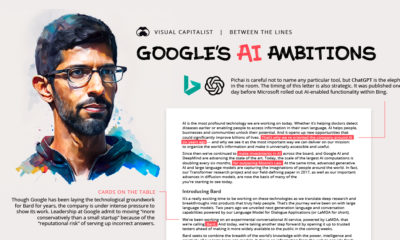

In a recent letter, Sundar Pichai reveals more than meets the eye. Here we read between the lines to provide more context into Google's position on...


In this visualization, we rank the top 50 websites that receive the most internet traffic, from Google to CNN.
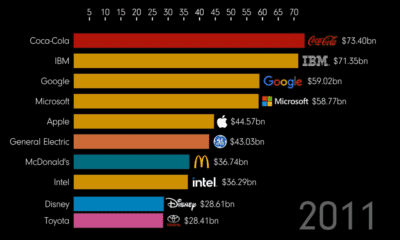

How much money is in a brand? And which brands have risen and fallen? This animation tracks the most valuable brands over 20+ years
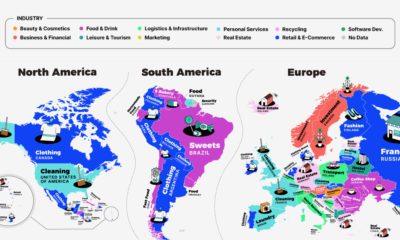

This series of maps shows a regional breakdown of the most popular types of businesses people want to start, based on online search results.
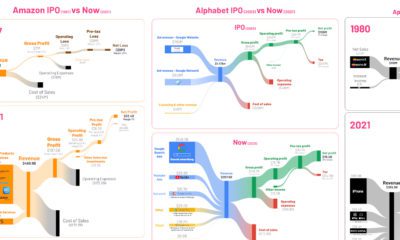

See the financials of major companies like Amazon and Tesla visualized, comparing their first year post-IPO with the most recent numbers.
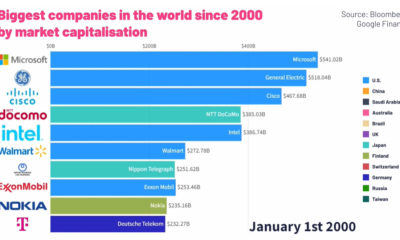

This animated graphic provides a breakdown of the world’s top ten largest public companies from 2000 to 2022.
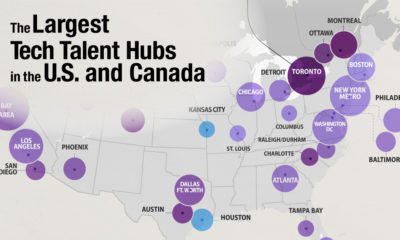

6.5 million skilled tech workers currently work in the U.S. and Canada. Here we look at the largest tech hubs across the two countries


 Creator Program