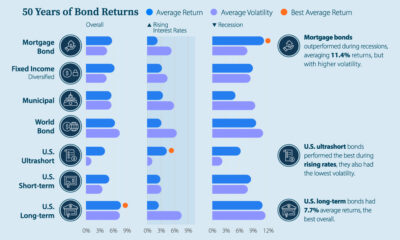

What factors impact the bond market? Here's how current interest rates, bond returns, and market volatility compare in a historical context.


How have investment returns for different portfolio allocations of stocks and bonds compared over the last 90 years?


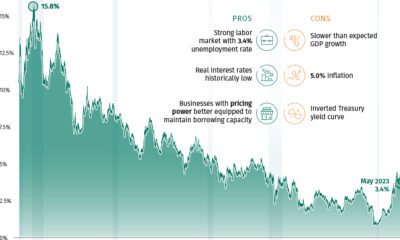
This infographic examines 50 years of data to highlight a clear visual trend: recessions are preceded by a cyclical low in unemployment.
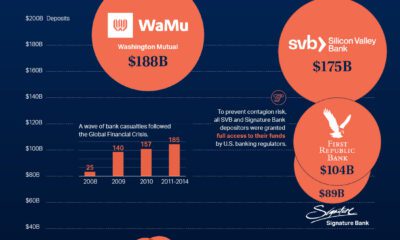

This graphic charts over 560 U.S. bank failures since 2001, including the most recent addition: First Republic Bank.


In a volatile and difficult year for many assets and equities, how have the world's major currencies performed against the U.S. dollar?
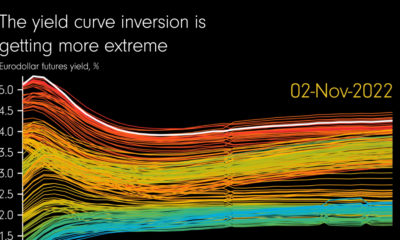

Since 1960, an inverted yield curve has preceded nearly every recession. This animation highlights how that inversion is becoming more extreme.

The Federal Reserve has raised U.S. interest rates five times in 2022, but how do today’s levels compare to historical interest rates?
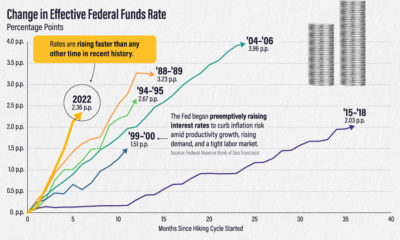

The effective federal funds rate has risen more than two percentage points in six months. How does this compare to other interest rate hikes?
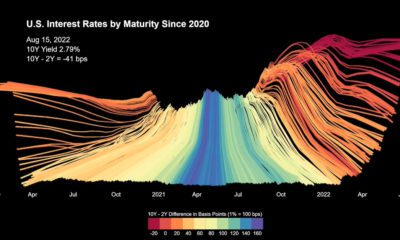

U.S. interest rates have risen sharply after sitting near historic lows. This animation charts their trajectory since 2020.
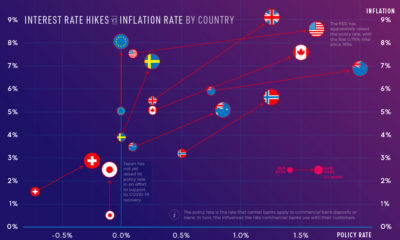

Inflation rates are reaching multi-decade highs in some countries. How aggressive have central banks been with interest rate hikes?


 Creator Program