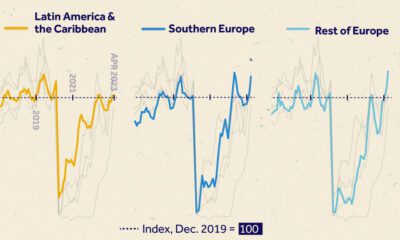

We visualize monthly foreign visitor arrivals, indexed to December 2019, indicating global tourism has all but recovered from COVID-19 disruptions.
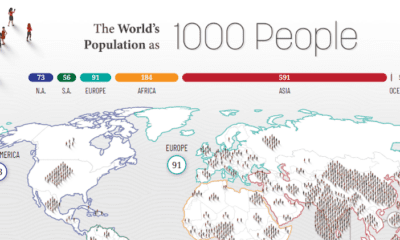

How would all the people in the world be spread out if there were only 1,000 people on Earth? This interactive map examines the breakdown.
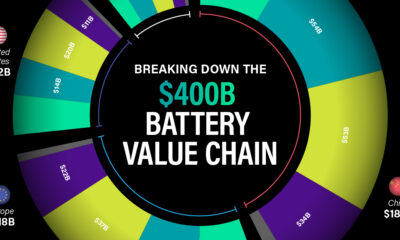

In this graphic, we break down where the $400 billion lithium battery industry will generate revenue in 2030.
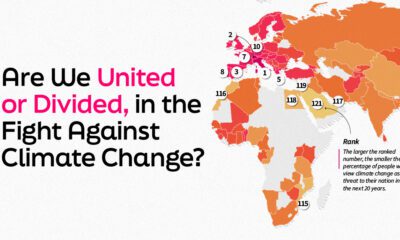

This graphic explores 121 nations thoughts on climate change and ranks them by the volume of their population who views it as a threat.


Data from the World Trade Organization highlights the world's 10 largest automotive exporters in 2022.
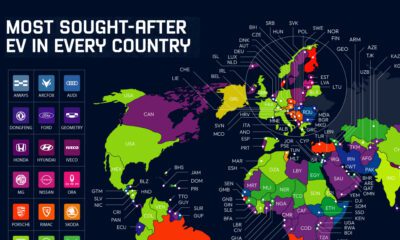

Industry stars, new entrants, and local models all populate this map of the most searched-for electric vehicles by country in 2022.
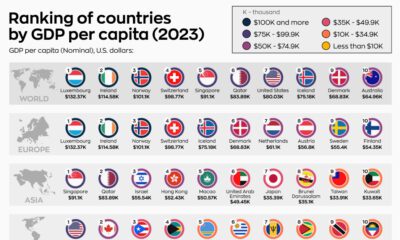

What are the world's top countries by GDP per capita? How do those rankings change when we adjust for purchasing power parity?


Which companies prioritize innovation the most? This infographic highlights BCG's 2023 Most Innovative Companies ranking.
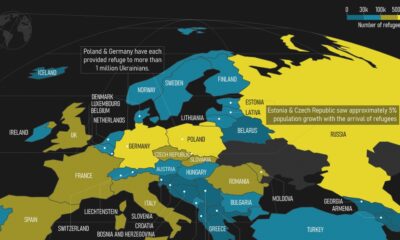

This map highlights European countries that became refugee destinations for Ukrainians who fled from the Russo-Ukrainian war.


Analyzing 2023 per capita GDP numbers from the International Monetary Fund lets us know where the richest countries in the world are.


 Creator Program