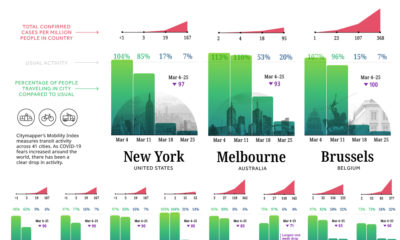

Amid the COVID-19 crisis, cities are dramatically slowing down. Today's chart demonstrates the impact of lockdowns on commuter activity worldwide.
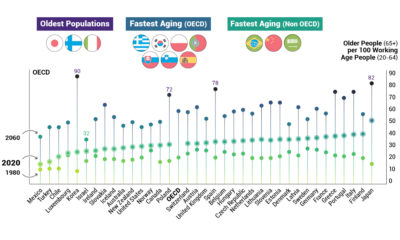

The data behind the world's rapidly aging population, and what it could mean for the economy and future generations of retirees.
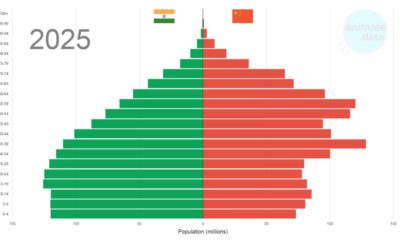

The world's two most populous countries have some economic similarities, but China and India are also diverging in one key area: demographics.
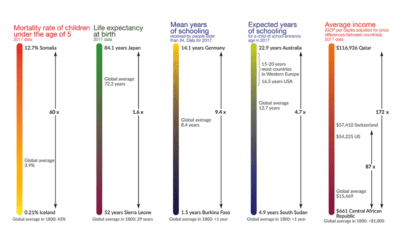

This visualization shows the global inequality gap — a difference in the standards of living around the world, as well as how it's changed over 200...
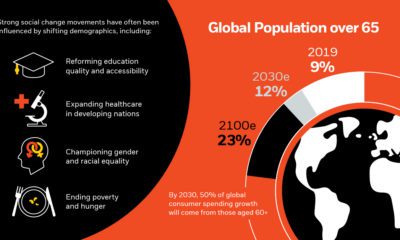

As societies evolve, demographics and social change also evolve, reshaping the world and resulting in new investment opportunities.
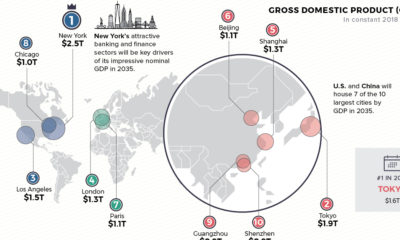

Cities are heavy hitters in the global economy. Where will the top 10 cities be in 2035—based on GDP, population, and annual growth?
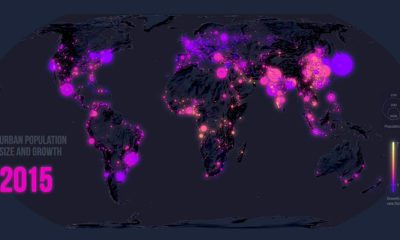

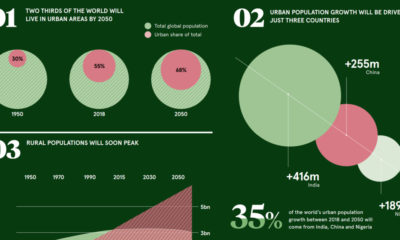
Few global trends have matched the profound impact of urbanization. Today’s map looks back at 70 years of movement in over 1,800 cities.
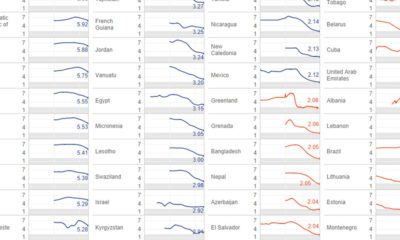

Global fertility has almost halved in the past century. Which countries are most resilient, and which have experienced the most dramatic changes over time?
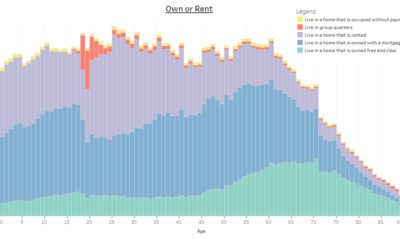

This interactive infographic allows you sort data on the U.S. population using a variety of topics, to see how Americans differ by age.

These pivotal trends show how urban demographics are aiding in the transition to a very different economic and investment landscape.


