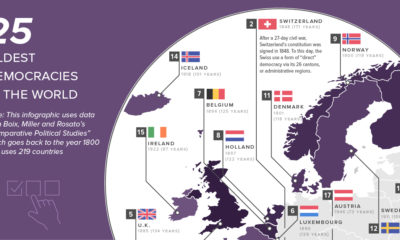

This map shows the 25 oldest democracies in the world, based on how long current democratic governments have been in continuous power.
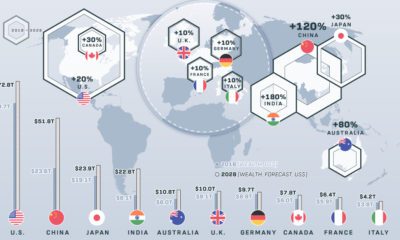

These 10 countries hold 74% of the world's $204 trillion in private wealth. How will this wealth of nations change over the next decade?
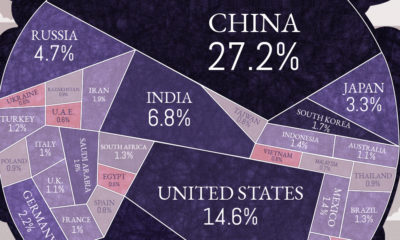

Just 15 countries are responsible for almost three quarters of the world’s carbon emissions. But what does this look like per capita, and over time?
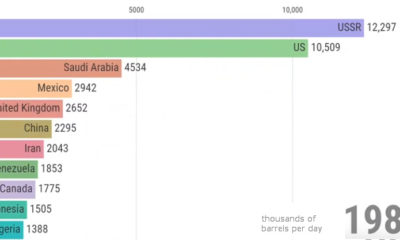

View how the ranking of the world's largest producers of crude oil changes over a 50 year period, from the Cold War until today.
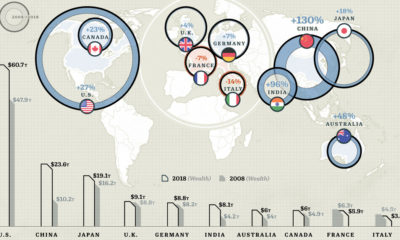

These countries hold 74% of the world's $204 trillion in private wealth. See the 10 richest countries, and how their totals have changed over time.
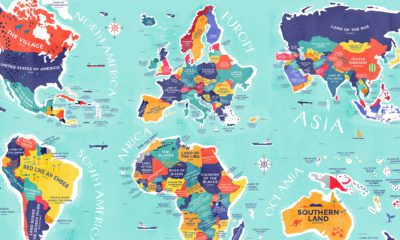

From Colombia to China, explore this map to uncover the diverse histories and cultures represented in the literal translation of each country's name.
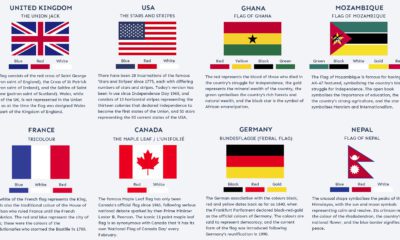

Many world flags are instantly recognizable, but there's more to it than meets the eye. What are the stories behind some of the world's most iconic...
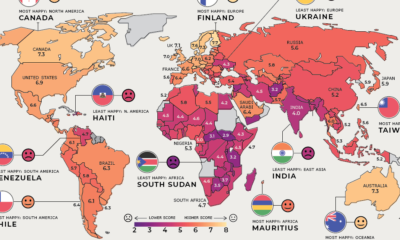

Where are the happiest, least happy, and fastest improving countries worldwide? We've broken down this annual ranking by region to answer that question.
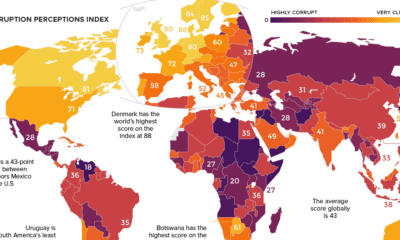

Which countries are the most (and least) corrupt? This world map shows the figures for the Corruption Perceptions Index (CPI) for 2018.
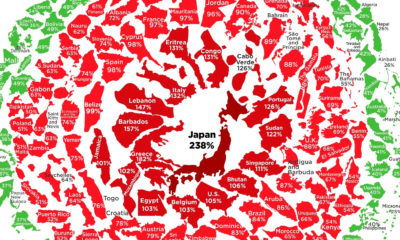

See the latest levels of government debt, based on the IMF's most recent data. Where does your country sit in the snowball?


