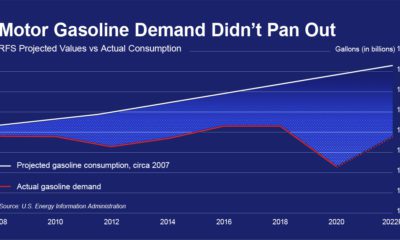

Biofuel mandates were passed in 2005, this graphic shows why they've become out of touch with modern transportation and are costing billions.
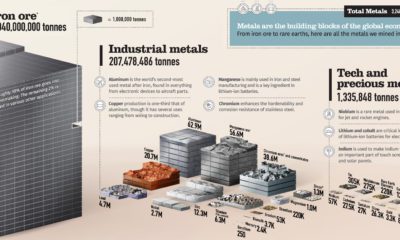

From iron ore to rare earths, over 3 billion tonnes of metals are mined each year. This chart shows them all on a relative scale.
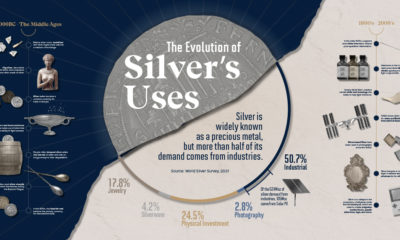

The uses of silver span various industries, from renewable energy to jewelry. See how the uses of silver have evolved in this infographic.
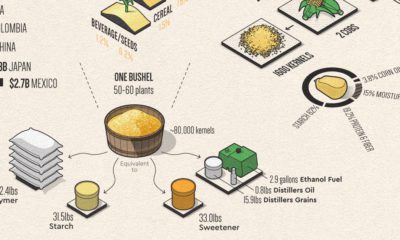

Corn has many uses that make modern life possible. This infographic breaks down U.S. corn usage in 2020.
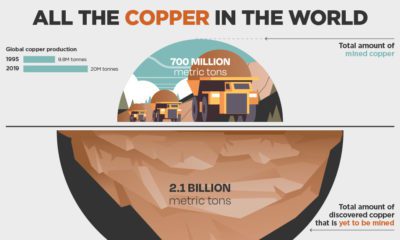

Are we running out of copper? This graphic from Trilogy Metals paints a clear picture of all the copper in the world, above and underground.

For 50 years, the CRU Group has tracked the commodities that drive the modern world, bringing macroeconomic insights to investors for accurate pricing.
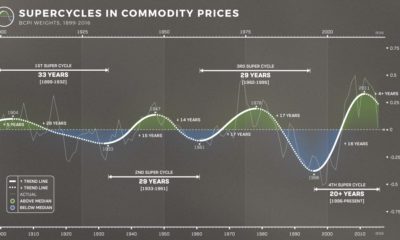

The prices of energy, agriculture, livestock and metals tell the story of human development. Learn about the commodity super cycle in this infographic.
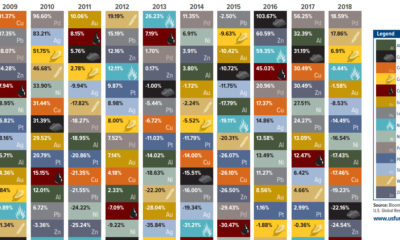

This unique chart shows the performance of individual commodities over the last decade - see commodity returns in 2018, and how they compared to previous years.

The emergence of the world’s renewable energy sector is setting the stage for a commodity boom - here's the bull case for 12 different metals going...
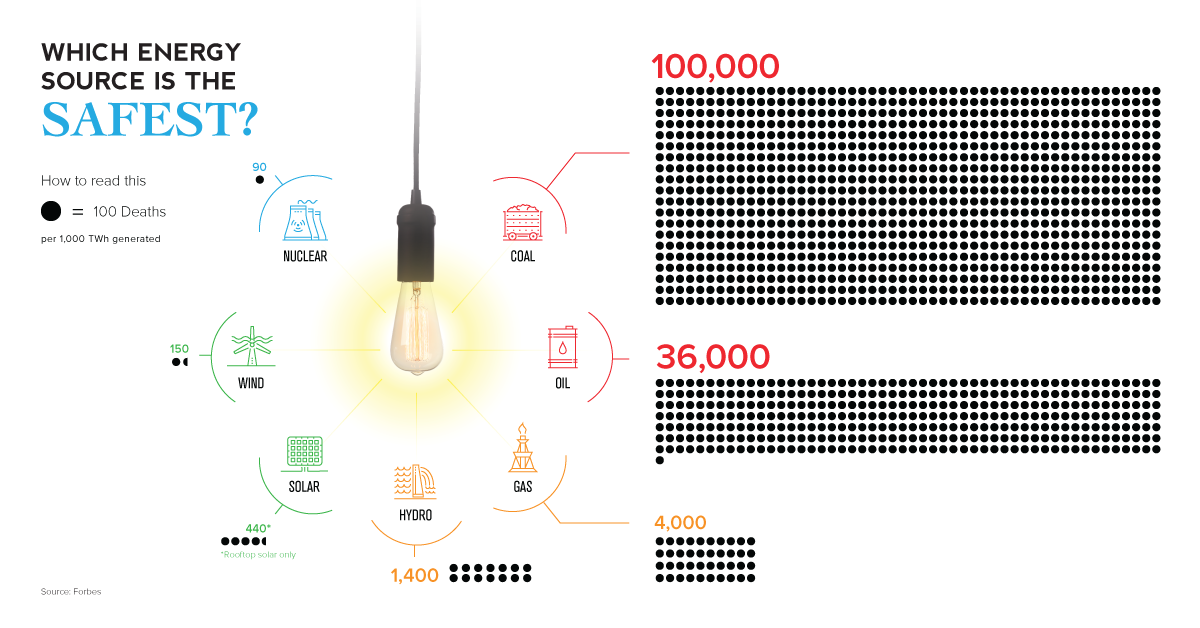
The empirical data on which energy source has led to the fewest human deaths may not be the one you expect.


