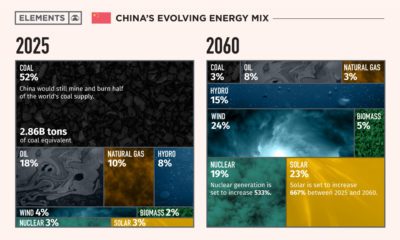

This infographic takes a look at what China's energy transition plans are to make its energy mix carbon neutral by 2060.
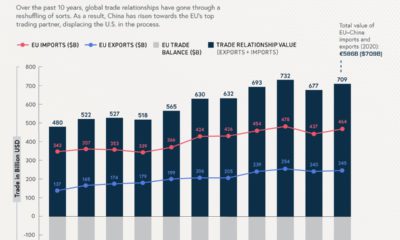

China has spearheaded its economy towards a global superpower, and as a result, has overtaken the U.S. as the EUs top trade partner
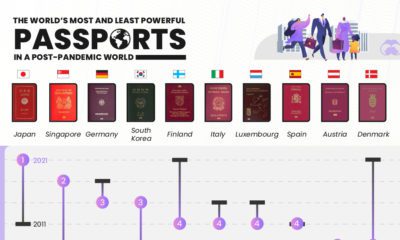

Ranking the the world's most powerful passports based on access to visa-free destinations. Where does your country fall on the list?
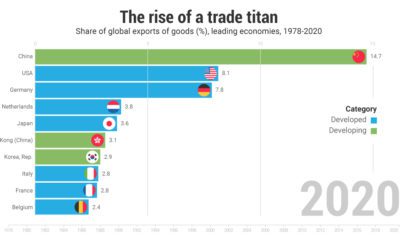

China's economy today is completely different than 40 years ago; in 2021 the country makes up the highest share of exports globally.
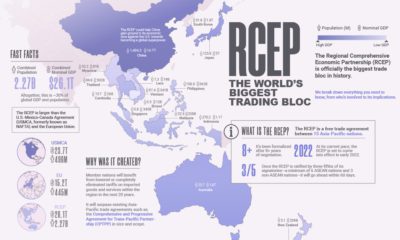

The Regional Comprehensive Economic Partnership (RCEP) covers 30% of global GDP and population. Here's everything you need to know about it.
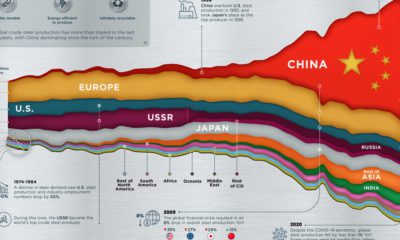

Global steel production has tripled over the past 50 years, with China's steel production eclipsing the rest of the world.
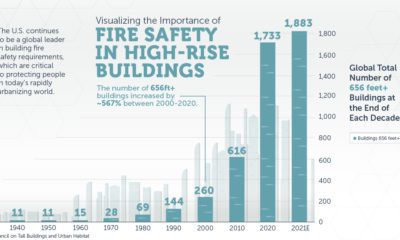

Fire safety is a critical feature of high-rise buildings, which are increasing in number every year as the world's urban population grows.
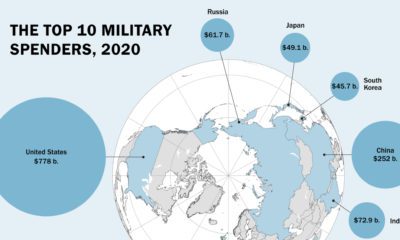

Global military spending is now at a 32-year high. We show countries' military spending by dollars and as a portion of GDP.
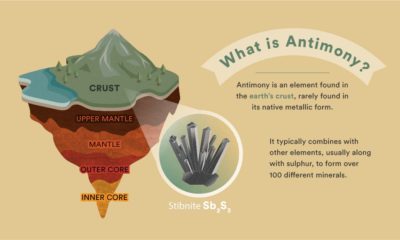

Despite its lack of fanfare, antimony is a critical mineral that plays an important role in the mass storage of renewable energy.
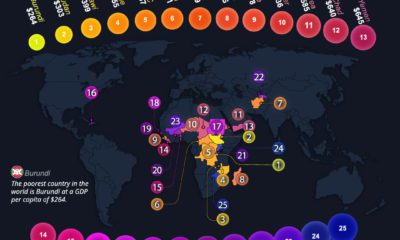

Which countries have the lowest GDP per capita? This map looks at the 25 poorest countries in the world in terms of GDP per capita.


