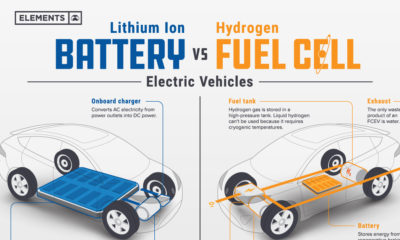

Understand the science behind hydrogen fuel cell vehicles, and how they differ from traditional EVs.
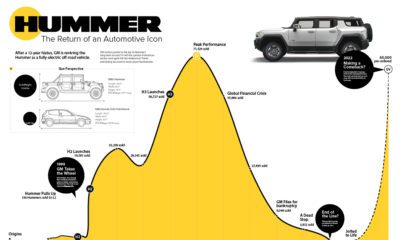

GM has received over 65,000 preorders for its upcoming Hummer EV. See how this compares to the brand's previous sales in one infographic.
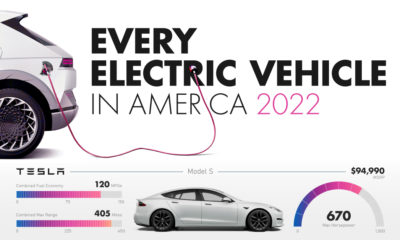

When it comes to purchasing electric cars, Americans have a few to choose from. Here’s a look at every electric vehicle sold in the U.S.
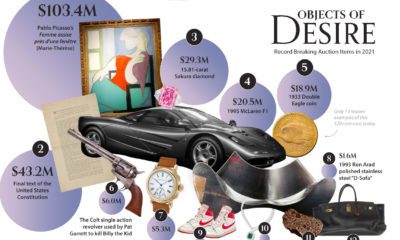

Do you have an eye for rare collectibles? See which items made the list of biggest auction sales in 2021.
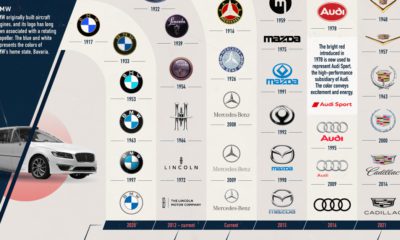

Automakers are some of the most recognizable brands in the world. See how car logos for these select brands have evolved over time in this graphic.
What's the lowest-carbon way to travel? Here's how much CO2 different types of vehicles emit per passenger-kilometer.
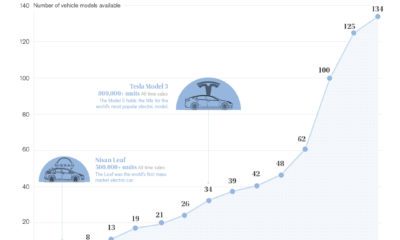

As legacy automakers transition to full electric, buyers in the U.S. can expect a wave of new EV models to arrive soon.
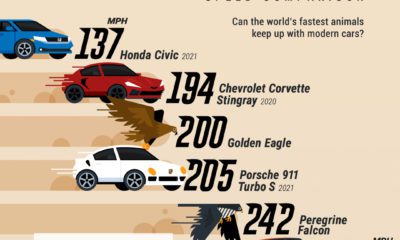

Ever wondered if an animal could outrun a modern car? This infographic puts the top speed of the world's fastest animals into context.
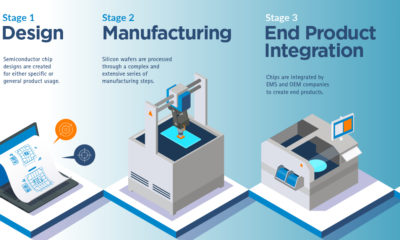

From smartphones to cars and factories, the semiconductor supply chain powers our entire digital economy.


Seatbelts first became mandatory in the US in 1968. Since then, new technologies have greatly reduced road fatalities.


