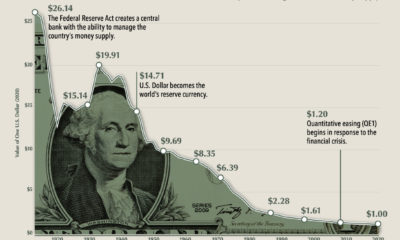

$1 in 1913 had the same purchasing power as $26 in 2020. This chart shows how the purchasing power of the dollar has changed over time.

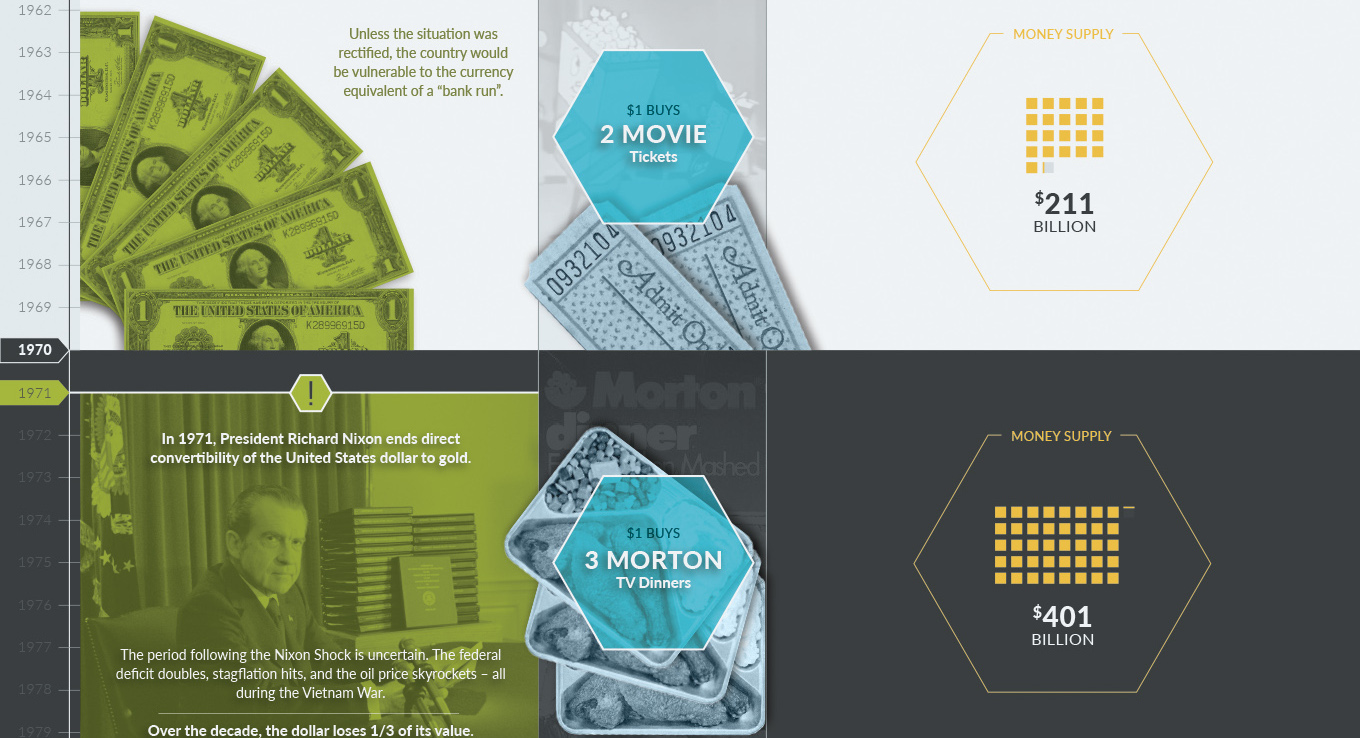
A timeline of U.S. monetary history shows the major events, the changing money supply, and the falling buying power of the U.S. dollar over time.