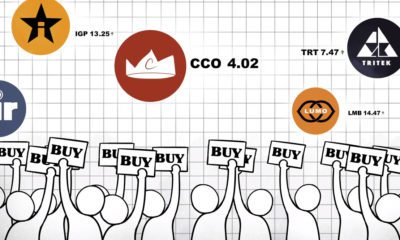

This video highlights the basics of the stock market, how they work, and also the history of how the first markets got started.
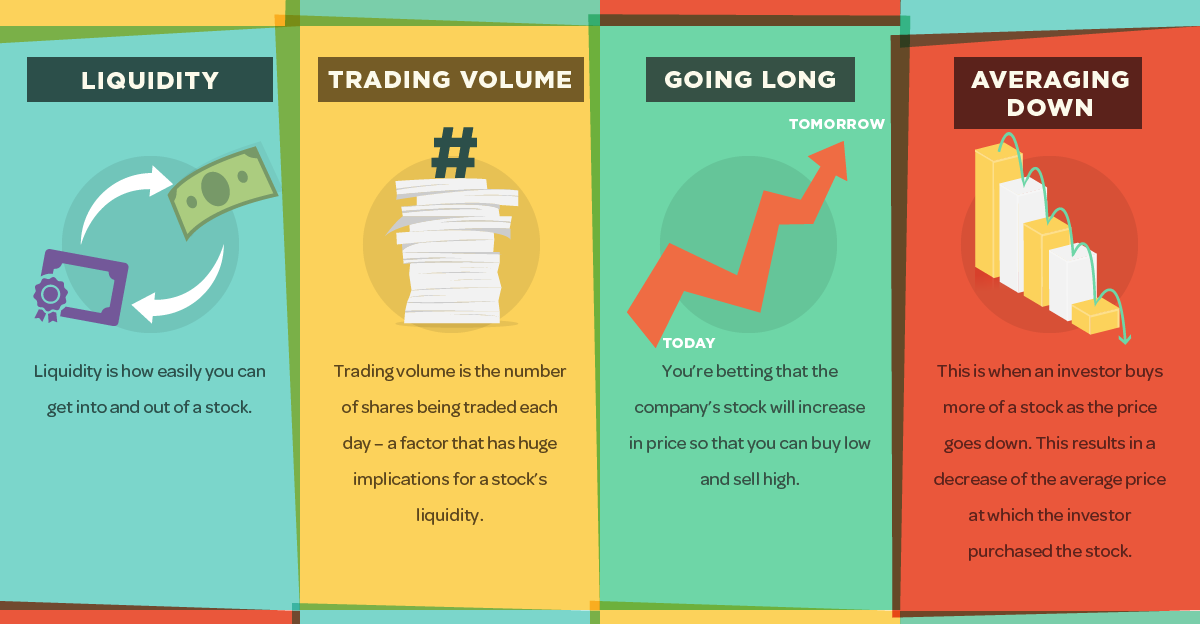
Getting a grasp on the market can be a daunting task for new investors, but this infographic is an easy first step to help in understanding...
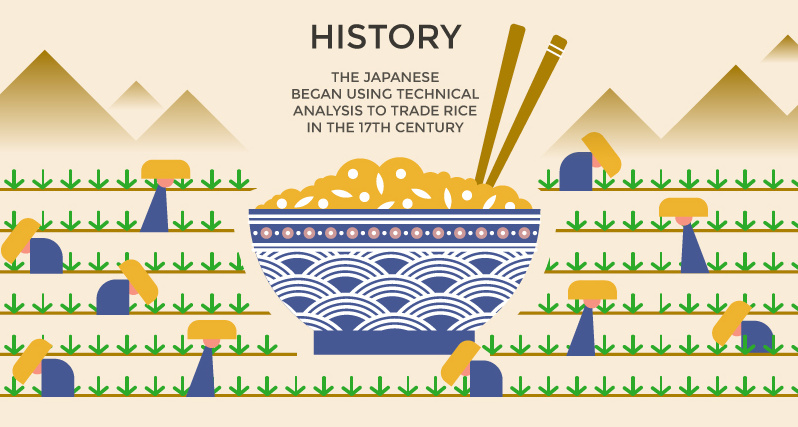
Originally used by 17th century rice traders in Japan, today candlestick charts are used by investors and traders to gauge the momentum of securities.
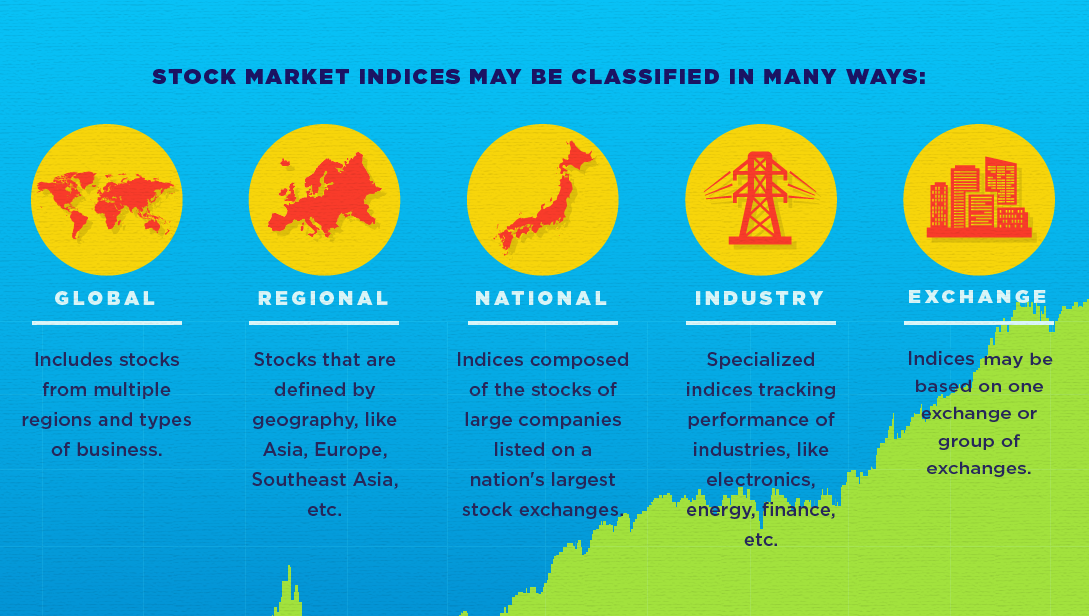
This infographic helps to explain the basics around what a stock market index is, and what it does.


