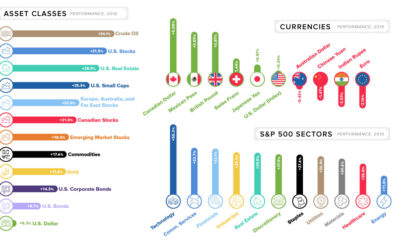

This quick graphic summary breaks down the final market numbers for 2019, looking at everything from currencies to broad asset classes.
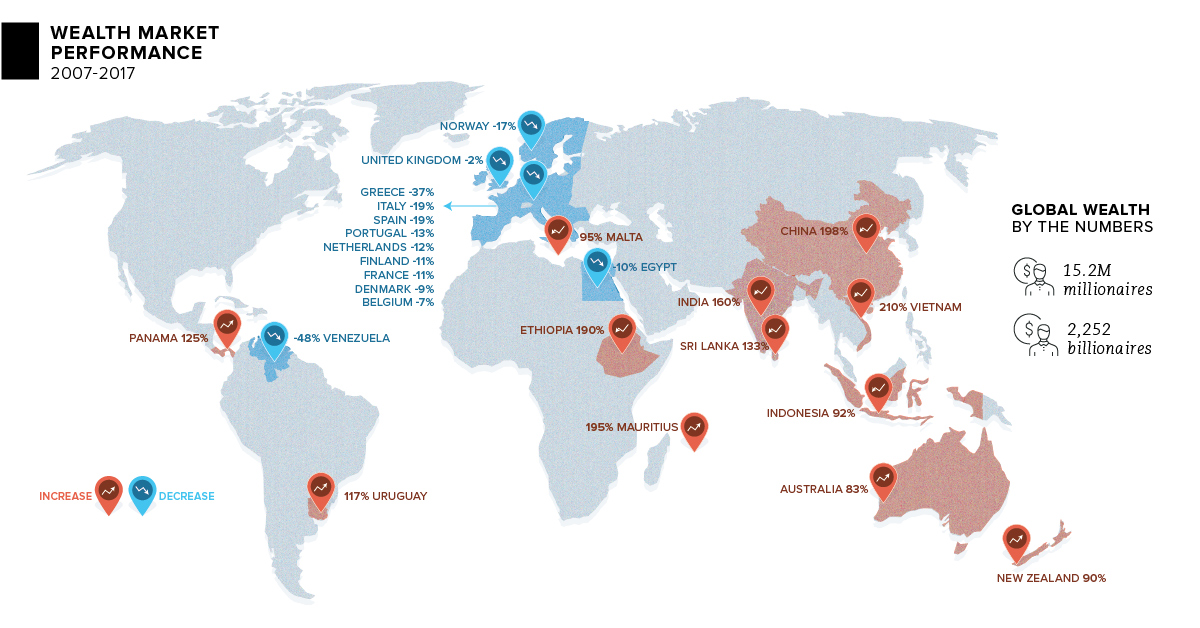
Wealth is not stagnant. Here's how it has shifted over the last decade from 2007-2017, including the winners and losers of the shift in wealth globally.
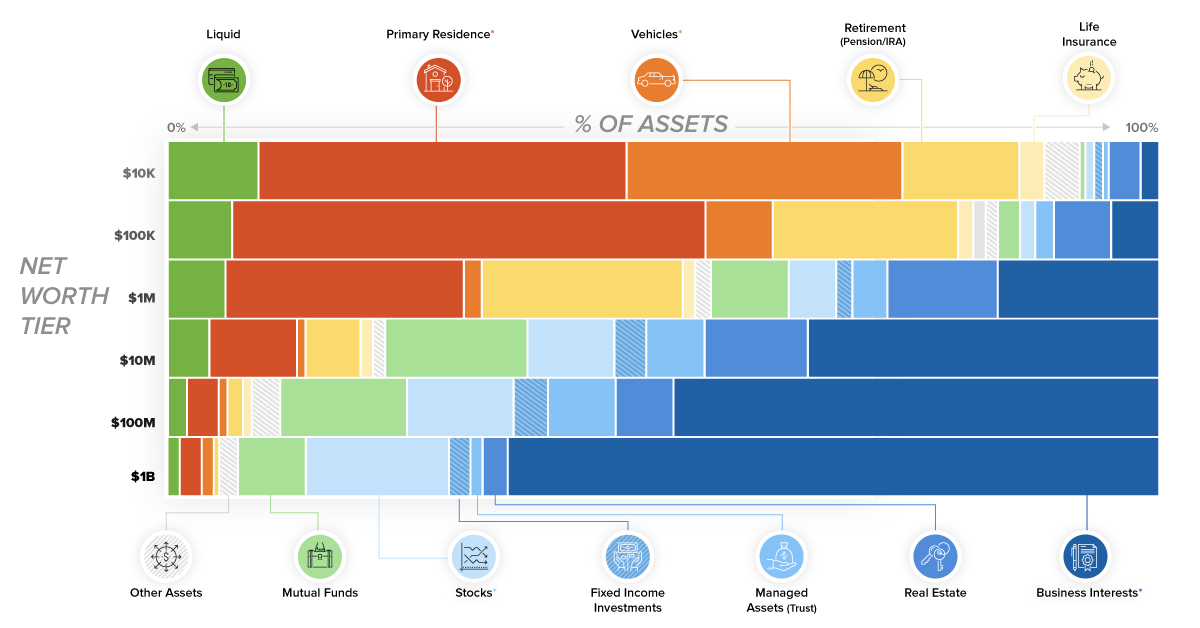
This chart breaks down the composition of assets for each tier of wealth. See what assets make up a regular person's net worth, versus that of...
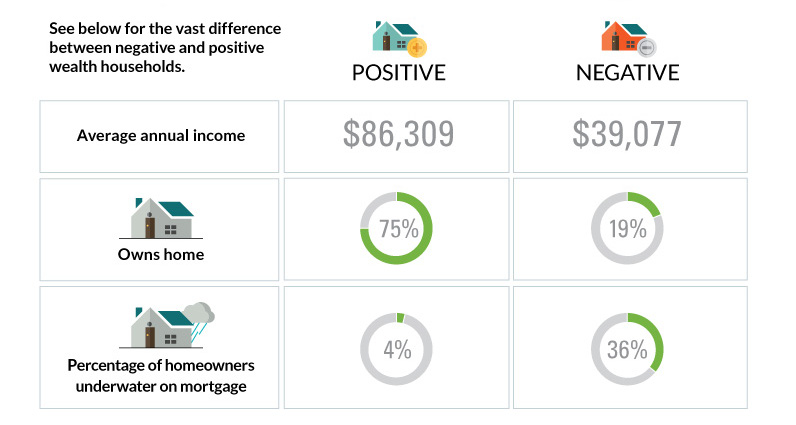
The differences between America's poorest homes - those with negative wealth - and their positive counterparts are stark and numerous.
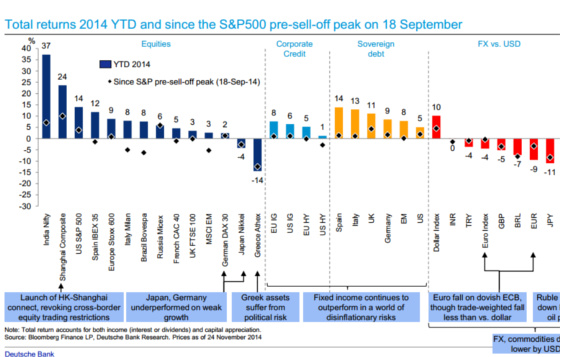
This Deutsche Bank chart shows the performance of every major asset class YTD so far in 2014.


