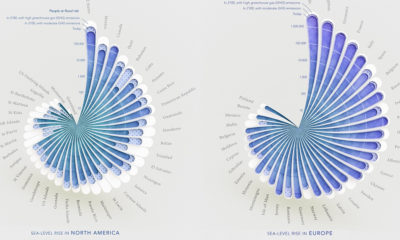

Here's a look at how people around the world could be impacted by coastal flooding by 2100, based on rising sea level projections.
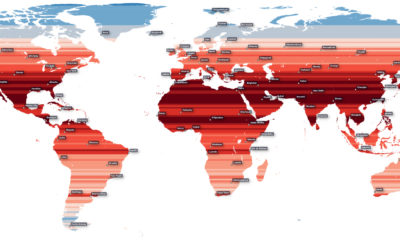

How much of the Earth’s population is located near the equator? This map visualizes the world’s population density by latitude.
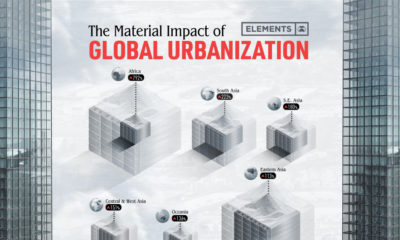

The world’s material consumption is expected to grow from 41 billion tonnes in 2010 to about 89 billion tonnes by 2050. This graphic shows the impact...
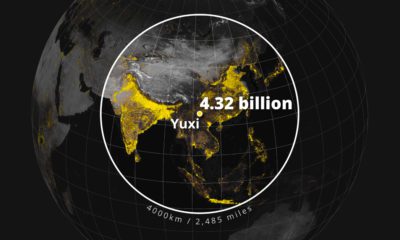

Population density varies across the globe. These maps use geographical circles to show the most densely populated areas on multiple continents.
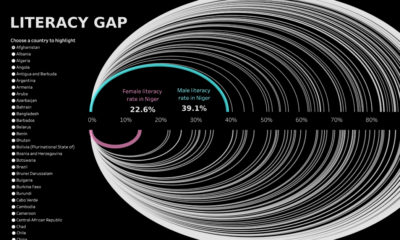

Global literacy rates have increased in the last few decades, but some countries are still lagging behind, especially in Sub-Saharan Africa.
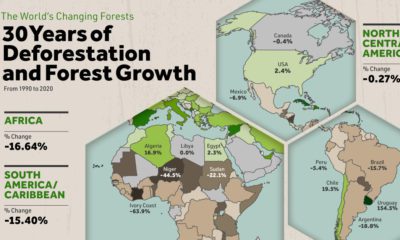

Where are the world's forests still shrinking, and where are they seeing net gains? We map deforestation by country between 1990-2020.
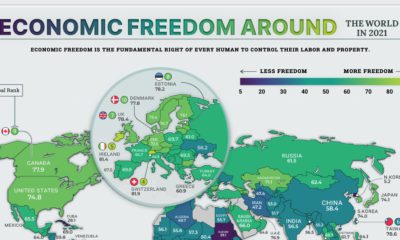

The global average economic freedom score is at the highest its been in 27 years. Here we map the economic freedom score of nearly every country.
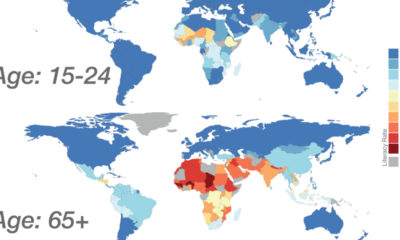

Global literacy mapped by generation, as well as a look at how the data on literacy has changed over time by country.
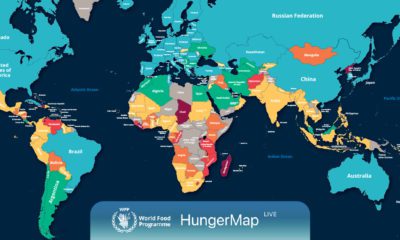

Every day, hunger affects more than 700 million people. This live map from the UN highlights where hunger is hitting hardest around the world.
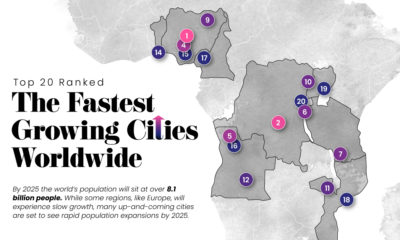

Nearly 60% of the world's population lives in cities and this trend is not slowing down—take a look at the world's 20 fastest growing cities.


 Creator Program