Technology
The Future of Supply Chain Automation
The Future of Supply Chain Automation
As Amazon continues to set the bar for efficiency by integrating an astounding spectrum of automation technology, it’s becoming increasingly apparent that traditional supply chain models are ripe for disruption.
For this reason, companies around the world are now rethinking their warehouse and distribution systems, with automation taking center stage.
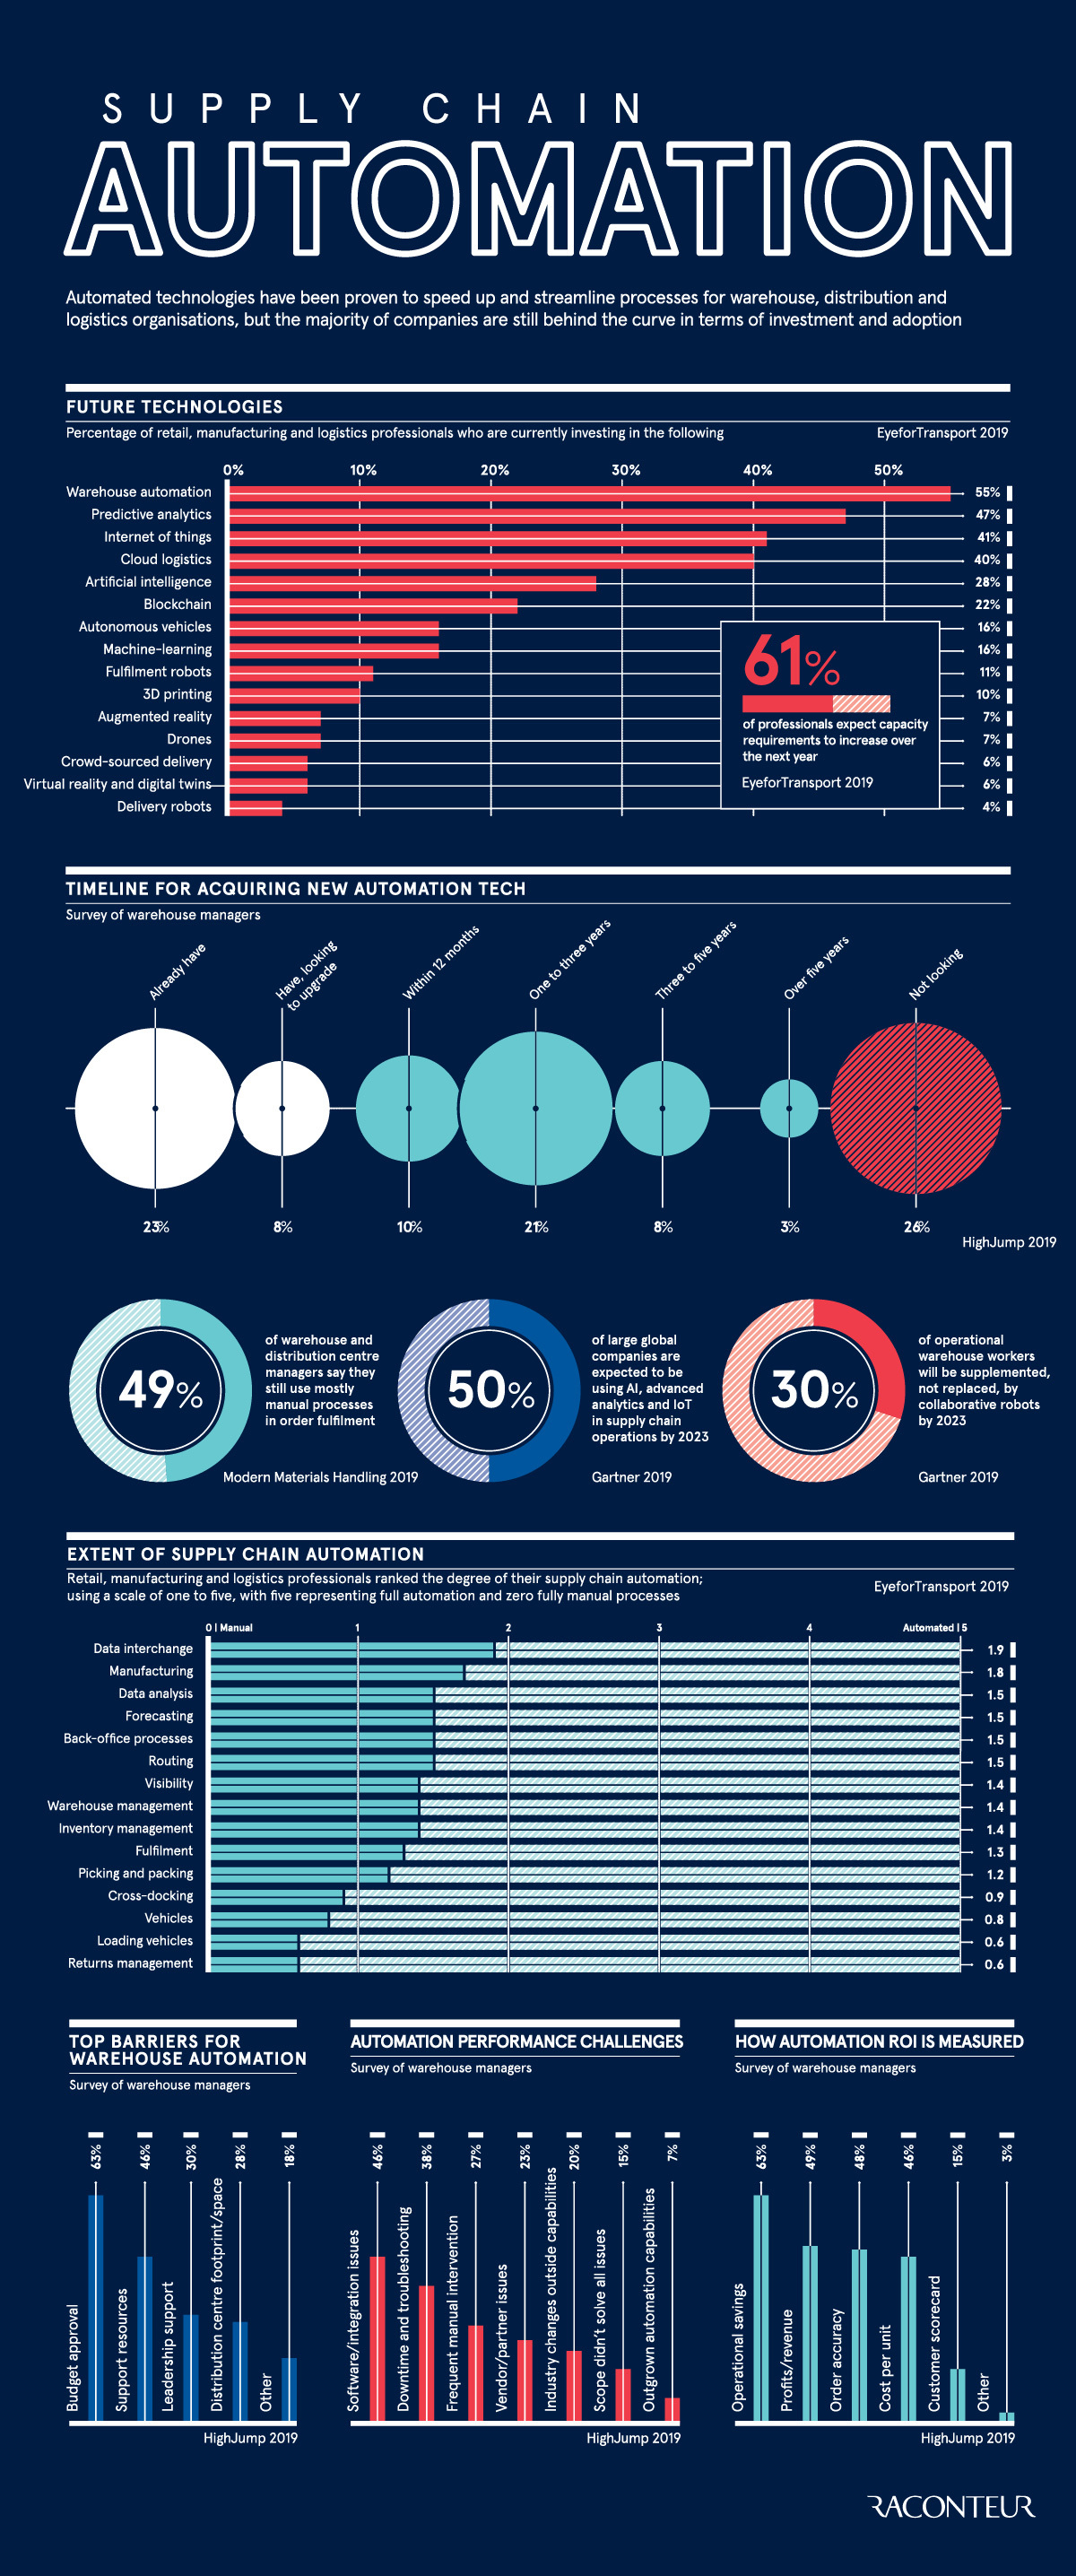
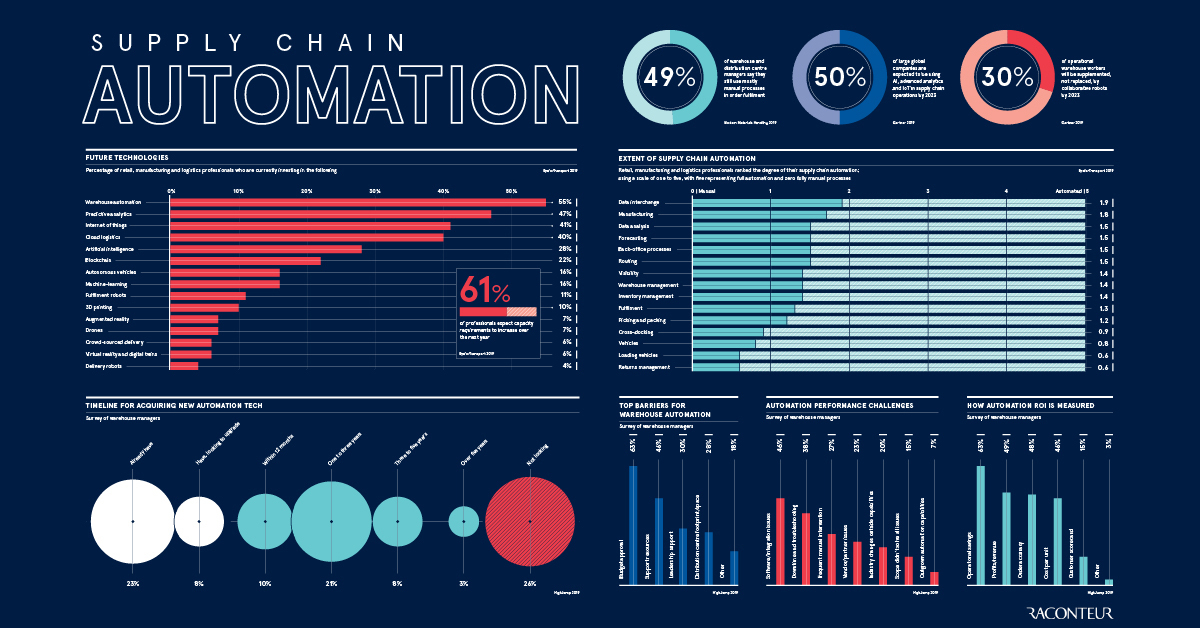
Today’s infographic from Raconteur highlights the state of automation across global supply chains, while also providing an outlook for future investment.
Long Time Coming
Let’s start by taking a look at what supply chain technologies are priorities for global industry investment in the first place:
| Rank | Technology | % of Companies* Investing in Tech |
|---|---|---|
| #1 | Warehouse automation | 55% |
| #2 | Predictive analytics | 47% |
| #3 | Internet of things | 41% |
| #4 | Cloud logistics | 40% |
| #5 | Artificial intelligence | 28% |
| #6 | Blockchain | 22% |
| #7 | Autonomous vehicles | 16% |
| #8 | Machine-learning | 16% |
| #9 | Fulfillment robots | 11% |
| #10 | 3D printing | 10% |
| #11 | Augmented reality | 7% |
| #12 | Drones | 7% |
| #13 | Crowd-sourced delivery | 6% |
| #14 | Virtual reality and digital twins | 6% |
| #15 | Delivery robots | 4% |
*Based on survey of supply chain professionals in retail, manufacturing, and logistics fields
As seen above, warehouse automation has already received more investment (55%) than any other supply chain technology on the list, as companies aim to cut delivery times and improve overall margins.
Interestingly, other areas receiving significant investment—such as predictive analytics, internet of things, or artificial intelligence—are technologies that could integrate well into the optimization of supply chain automation as well.
Smoothing the Transition
While fully automated supply chains in most industries may still be a few years away, here is how companies are investing in an automated future today:
| Timeline For Acquiring New Automation Tech | % of Warehouse Managers Surveyed |
|---|---|
| Already have | 23% |
| Have, looking to upgrade | 8% |
| Within 12 months | 10% |
| One to three years | 21% |
| Three to five years | 8% |
| Over five years | 3% |
| Not looking | 26% |
According to the above data, over 70% have already integrated automation technology, or are planning to within the next five years. On the flip side, over a quarter of warehouse managers are not currently looking to integrate any new automation tech into their operations at all.
Adoption Rates and Growth
As supply chain automation gains momentum and industry acceptance, individual processes will have varying adoption rates.
Take order fulfillment, for instance. Here, only 4% of current operations are highly automated according to a recent survey from Peerless Research Group:
| Order Fulfillment Operations (Picking and Packaging) | Percentage of Respondents |
|---|---|
| Highly automated | 4% |
| A mix of automated and manual processes | 42% |
| Mostly or all manual | 49% |
| Not applicable | 5% |
Meanwhile, 49% of operations were primarily manual, illustrating potential for growth in this particular area.
It’s worth noting that other individual supply chain components, such as conveyor belts, storage, automated guided vehicles, and shuttle systems, will all have differing trajectories for automation and growth.
Post-COVID Supply Chains
The COVID-19 pandemic has shown us that complex supply chains can become fragile under the right circumstances.
As supply chains see increased rates of automation and data collection becomes more integrated into these processes, it’s possible that future risks embedded in these systems could be mitigated.


Technology
Visualizing AI Patents by Country
See which countries have been granted the most AI patents each year, from 2012 to 2022.


Visualizing AI Patents by Country
This was originally posted on our Voronoi app. Download the app for free on iOS or Android and discover incredible data-driven charts from a variety of trusted sources.
This infographic shows the number of AI-related patents granted each year from 2010 to 2022 (latest data available). These figures come from the Center for Security and Emerging Technology (CSET), accessed via Stanford University’s 2024 AI Index Report.
From this data, we can see that China first overtook the U.S. in 2013. Since then, the country has seen enormous growth in the number of AI patents granted each year.
| Year | China | EU and UK | U.S. | RoW | Global Total |
|---|---|---|---|---|---|
| 2010 | 307 | 137 | 984 | 571 | 1,999 |
| 2011 | 516 | 129 | 980 | 581 | 2,206 |
| 2012 | 926 | 112 | 950 | 660 | 2,648 |
| 2013 | 1,035 | 91 | 970 | 627 | 2,723 |
| 2014 | 1,278 | 97 | 1,078 | 667 | 3,120 |
| 2015 | 1,721 | 110 | 1,135 | 539 | 3,505 |
| 2016 | 1,621 | 128 | 1,298 | 714 | 3,761 |
| 2017 | 2,428 | 144 | 1,489 | 1,075 | 5,136 |
| 2018 | 4,741 | 155 | 1,674 | 1,574 | 8,144 |
| 2019 | 9,530 | 322 | 3,211 | 2,720 | 15,783 |
| 2020 | 13,071 | 406 | 5,441 | 4,455 | 23,373 |
| 2021 | 21,907 | 623 | 8,219 | 7,519 | 38,268 |
| 2022 | 35,315 | 1,173 | 12,077 | 13,699 | 62,264 |
In 2022, China was granted more patents than every other country combined.
While this suggests that the country is very active in researching the field of artificial intelligence, it doesn’t necessarily mean that China is the farthest in terms of capability.
Key Facts About AI Patents
According to CSET, AI patents relate to mathematical relationships and algorithms, which are considered abstract ideas under patent law. They can also have different meaning, depending on where they are filed.
In the U.S., AI patenting is concentrated amongst large companies including IBM, Microsoft, and Google. On the other hand, AI patenting in China is more distributed across government organizations, universities, and tech firms (e.g. Tencent).
In terms of focus area, China’s patents are typically related to computer vision, a field of AI that enables computers and systems to interpret visual data and inputs. Meanwhile America’s efforts are more evenly distributed across research fields.
Learn More About AI From Visual Capitalist
If you want to see more data visualizations on artificial intelligence, check out this graphic that shows which job departments will be impacted by AI the most.

-

 Markets1 week ago
U.S. Debt Interest Payments Reach $1 Trillion
-

 Business2 weeks ago
Charted: Big Four Market Share by S&P 500 Audits
-

 Real Estate2 weeks ago
Ranked: The Most Valuable Housing Markets in America
-

 Money2 weeks ago
Which States Have the Highest Minimum Wage in America?
-

 AI2 weeks ago
Ranked: Semiconductor Companies by Industry Revenue Share
-

 Markets2 weeks ago
Ranked: The World’s Top Flight Routes, by Revenue
-

 Demographics2 weeks ago
Population Projections: The World’s 6 Largest Countries in 2075
-

 Markets2 weeks ago
The Top 10 States by Real GDP Growth in 2023