Green
This Stunning Graphic Shows Earth’s Temperature Over 22,000 Years
Climate change is a touchy subject, and it’s something that we only approach with the utmost deliberation and care.
However, as simple or as light-hearted as it appears at first glance, today’s infographic actually provides an invaluable amount of context on a subject that is often mired in the ugly details of mathematical models, multipliers, and policy implications.
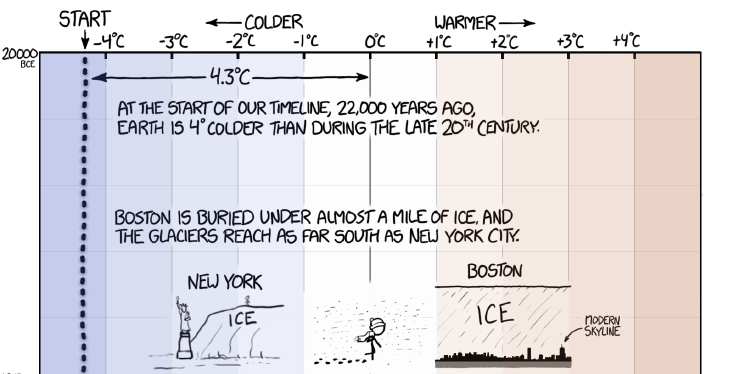
Earth’s Temperature Over 22,000 Years
Today’s infographic from XKCD shows the Earth’s temperature since the last ice age glaciation, which was 22,000 years ago. It was around this time that there were vast ice sheets covering North America, northern Europe, and Asia.

This infographic does two things very well.
First, it gives us an idea of temperature changes over time in a relatable fashion, but it also gives us a sense of time scale.
Temperature Changes in Context
Temperatures were cold at the end of the last glaciation, which was around 20,000 BCE – about 4°C cooler than they were during the modern era. Boston and New York would have been covered in thick ice at that time.
Fast-forward half of the span of the infographic, and temperatures have increased to near modern levels (the average between 1961-1990) in about 11,000 years. This would have been around 9,000 BCE, which is around the time the very first humans started farming way back in today’s Middle East region.
From there, temperatures continue to increase for another 4,000 years, peaking around the time that the wheel was invented. This was around 5,000 BCE, which is still considered to be the end of the Stone Age. This is an era still well before the Ancient Egyptians rose to prominence.
The Earth cools again. By the time of the birth of Jesus, temperatures are close again to to those in the modern era. It continues to cool until Shakespearian times, which were in the middle of what is called the “Little Ice Age”.
Finally, after the Industrial Revolution, temperatures spike at a rate not seen before. In the short span of just a century or so, temperatures are back at their previous peak that occurred when the wheel was invented – roughly 7,000 years ago.
Sources used: Shakun et al (2012), Marcott et al (2013), Annan and Hargreaves (2013), HadCRUT4, IPCC,


Green
Ranking the Top 15 Countries by Carbon Tax Revenue
This graphic highlights France and Canada as the global leaders when it comes to generating carbon tax revenue.


Top 15 Countries by Carbon Tax Revenue
This was originally posted on our Voronoi app. Download the app for free on iOS or Android and discover incredible data-driven charts from a variety of trusted sources.
Carbon taxes are designed to discourage CO2 emissions by increasing the cost of carbon-intensive activities and incentivizing the adoption of cleaner energy alternatives.
In this graphic we list the top 15 countries by carbon tax revenue as of 2022. The data is from the World Bank’s State and Trends of Carbon Pricing Report, published in April 2023.
France and Canada Lead in Global Carbon Tax Revenue
In 2022, the top 15 countries generated approximately $30 billion in revenue from carbon taxes.
France and Canada lead in this regard, accounting for over half of the total amount. Both countries have implemented comprehensive carbon pricing systems that cover a wide range of sectors, including transportation and industry, and they have set relatively high carbon tax rates.
| Country | Government revenue in 2022 ($ billions) |
|---|---|
| 🇫🇷 France | $8.9 |
| 🇨🇦 Canada | $7.8 |
| 🇸🇪 Sweden | $2.3 |
| 🇳🇴 Norway | $2.1 |
| 🇯🇵 Japan | $1.8 |
| 🇫🇮 Finland | $1.7 |
| 🇨🇭 Switzerland | $1.6 |
| 🇬🇧 United Kingdom | $0.9 |
| 🇮🇪 Ireland | $0.7 |
| 🇩🇰 Denmark | $0.5 |
| 🇵🇹 Portugal | $0.5 |
| 🇦🇷 Argentina | $0.3 |
| 🇲🇽 Mexico | $0.2 |
| 🇸🇬 Singapore | $0.1 |
| 🇿🇦 South Africa | $0.1 |
In Canada, the total carbon tax revenue includes both national and provincial taxes.
While carbon pricing has been recognized internationally as one of the more efficient mechanisms for reducing CO2 emissions, research is divided over what the global average carbon price should be to achieve the goals of the Paris Climate Agreement, which aims to limit global warming to 1.5–2°C by 2100 relative to pre-industrial levels.
A recent study has shown that carbon pricing must be supported by other policy measures and innovations. According to a report from Queen’s University, there is no feasible carbon pricing scenario that is high enough to limit emissions sufficiently to achieve anything below 2.4°C warming on its own.

-

 Green2 weeks ago
Ranked: Top Countries by Total Forest Loss Since 2001
-

 Travel2 weeks ago
Ranked: The World’s Top Flight Routes, by Revenue
-

 Technology2 weeks ago
Ranked: Semiconductor Companies by Industry Revenue Share
-

 Money2 weeks ago
Which States Have the Highest Minimum Wage in America?
-

 Real Estate2 weeks ago
Ranked: The Most Valuable Housing Markets in America
-

 Markets2 weeks ago
Charted: Big Four Market Share by S&P 500 Audits
-

 AI2 weeks ago
The Stock Performance of U.S. Chipmakers So Far in 2024
-

 Automotive2 weeks ago
Almost Every EV Stock is Down After Q1 2024