Personal Finance
Mapped: Personal Finance Education Requirements, by State


The Percentage of Students Receiving Personal Finance Education
When you graduated from high school, did you know how to create a budget? Did you have an understanding of what stocks and bonds were? Did you know how to do your own taxes?
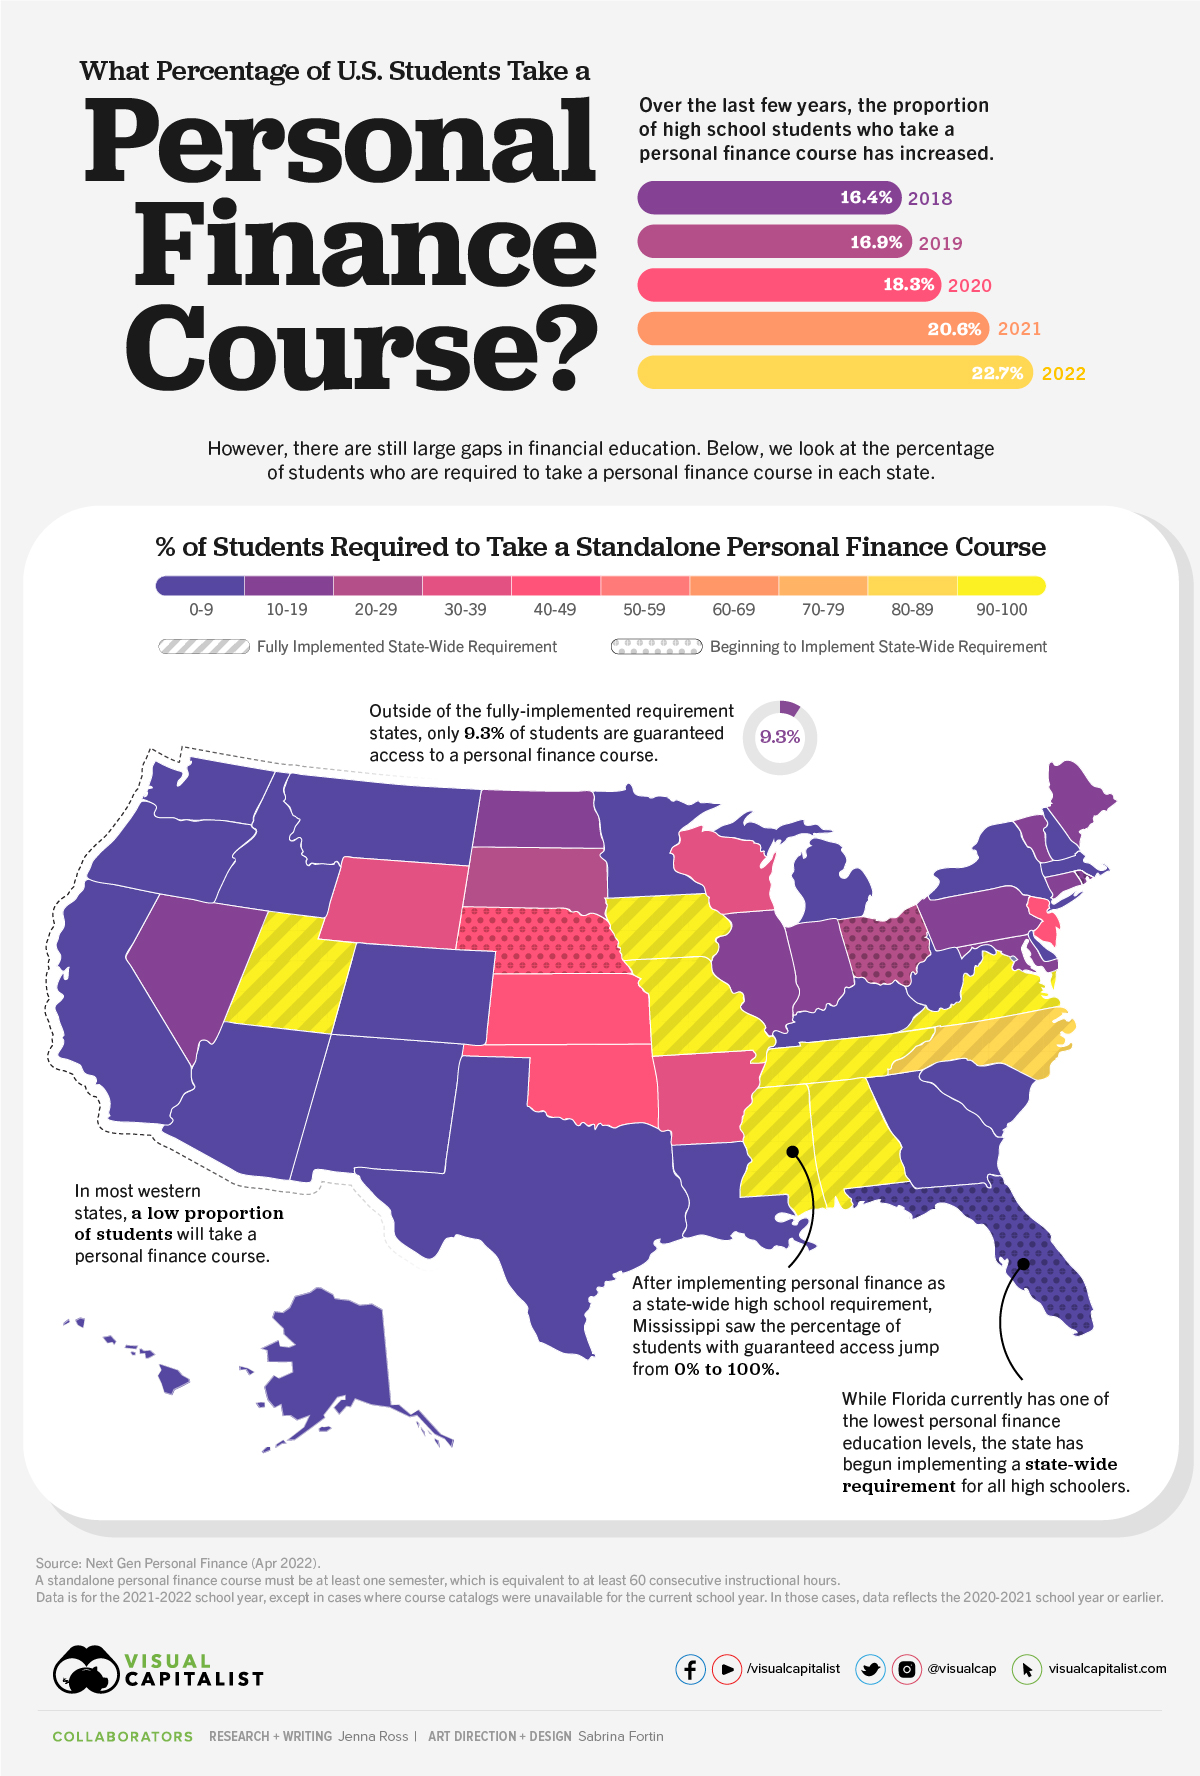
For many Americans, the answer to these questions is probably a “no”. Only 22.7% of U.S. high school students are guaranteed to receive a personal finance education. While this is up from 16.4% in 2018, this still represents a small fraction of students.
This graphic uses data from Next Gen Personal Finance (NGPF) to show the percentage of high school students required to take a personal finance course by state.
A Closer Look at State-level Personal Finance Education
A standalone personal finance course was defined as a course that was at least one semester, which is equivalent to 60 consecutive instructional hours. Here’s the percentage of students in each state who have a required (not optional) personal finance course.
| State/Territory | % of Students Required to Take Personal Finance Course |
|---|---|
| Mississippi | 100.0% |
| Missouri | 100.0% |
| Virginia | 100.0% |
| Tennessee | 99.7% |
| Alabama | 99.6% |
| Utah | 99.6% |
| Iowa | 91.3% |
| North Carolina | 89.2% |
| Oklahoma | 47.1% |
| New Jersey | 43.0% |
| Nebraska | 42.8% |
| Kansas | 40.8% |
| Wyoming | 38.3% |
| Arkansas | 34.6% |
| Wisconsin | 33.5% |
| South Dakota | 27.1% |
| Ohio | 23.5% |
| Pennsylvania | 16.2% |
| Maine | 15.6% |
| Rhode Island | 14.8% |
| Connecticut | 14.7% |
| Illinois | 13.9% |
| Maryland | 12.5% |
| North Dakota | 12.2% |
| Vermont | 12.1% |
| Nevada | 11.0% |
| Indiana | 10.9% |
| Oregon | 7.5% |
| Minnesota | 6.9% |
| Montana | 6.9% |
| New Hampshire | 6.0% |
| Kentucky | 5.5% |
| Colorado | 5.4% |
| Delaware | 5.0% |
| Massachusetts | 5.0% |
| West Virginia | 3.2% |
| Louisiana | 2.7% |
| Washington | 2.4% |
| Texas | 2.2% |
| New York | 2.0% |
| Michigan | 1.7% |
| Idaho | 1.4% |
| Arizona | 1.0% |
| California | 0.8% |
| South Carolina | 0.8% |
| Alaska | 0.6% |
| Florida | 0.4% |
| New Mexico | 0.4% |
| Georgia | 0.0% |
| Hawaii | 0.0% |
| Washington, D.C. | 0.0% |
Eight states currently have state-wide requirements for a personal finance course: Alabama, Mississippi, Missouri, Iowa, North Carolina, Tennessee, Utah, and Virginia. Naturally, the level of personal finance education is highest in these states.
Five states have begun the process of implementing a requirement, with Florida being the most populous state yet to guarantee personal finance education for high schoolers. The state previously required schools to offer a personal finance course as an elective, but only 5% of students took the course.
Outside of the guarantee states, only 9.3% of students are required to take a personal finance course. That number drops to 5% for schools that have a high percentage of Black or Brown students, while students eligible for a free or reduced lunch program (i.e. lower income students) also hover at the 5% number.
Why is Personal Financial Education Important?
The majority of Americans believe parents are responsible for teaching their children about personal finance. However, nearly a third of parents say they never talk to their children about finances. Personal finance education at school is one way to help fill that gap.
People who have received a financial education tend to have a higher level of financial literacy. In turn, this can lead to people being less likely to face financial difficulties.
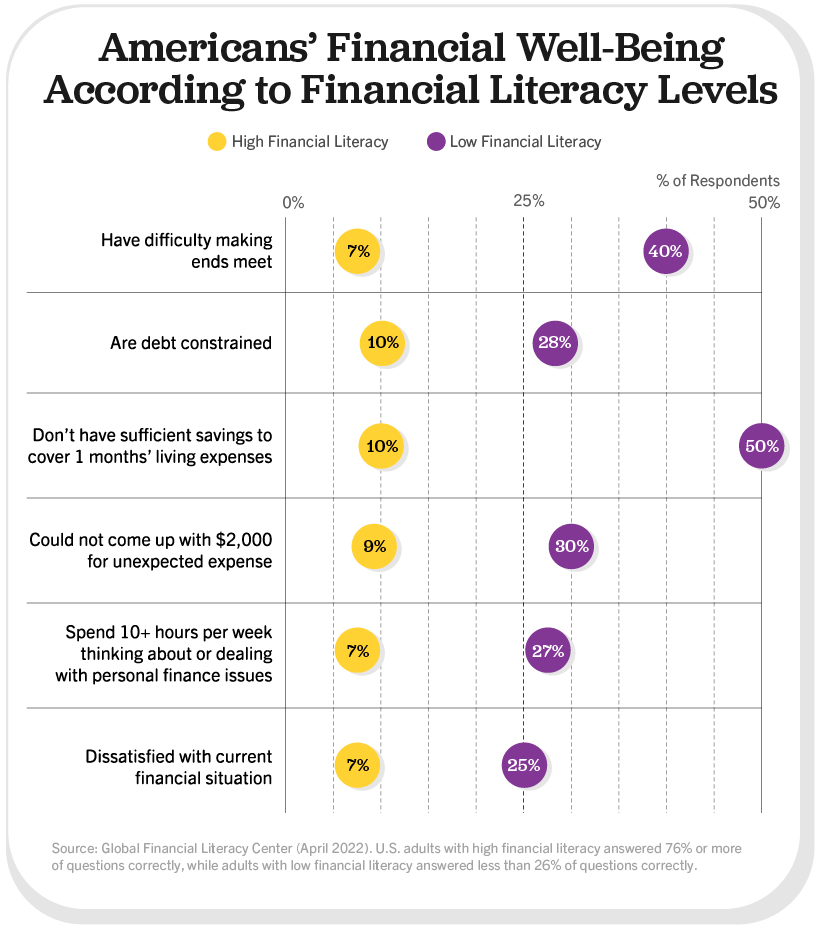
People with low levels of financial literacy were five times more likely to be unable to cover one month of living expenses, when compared to people with high financial literacy. Separate research has found that implementing a state mandate for personal finance education led to improved credit scores and reduced delinquency rates.
Not only that, financial education can play a key role in building wealth. One survey found that only one-third of millionaires averaged a six-figure income over the course of their career. Instead of relying on high salaries, the success of most millionaires came from employing basic personal finance principles: investing early and consistently, avoiding credit card debt, and spending carefully using tools like budgets and coupons.
Expanding Access to Financial Education
Once the in-progress state requirements have been fully implemented, more than a third of U.S. high school students will have guaranteed access to a personal finance course. Momentum is expanding beyond guarantee states, too. There are 48 personal finance bills pending in 18 states according to NGPF’s financial education bill tracker.
Importantly, 88% of surveyed adults support personal finance education mandates—and most wish they had also been required to take a personal finance course themselves.
When we ask the next generation of graduates if they understand how to build a budget, it’s more likely that they will confidently say “yes”.


Personal Finance
Chart: The Declining Value of the U.S. Federal Minimum Wage
This graphic compares the nominal vs. inflation-adjusted value of the U.S. minimum wage, from 1940 to 2023.


The Declining Value of the U.S. Federal Minimum Wage
This was originally posted on our Voronoi app. Download the app for free on iOS or Android and discover incredible data-driven charts from a variety of trusted sources.
This graphic illustrates the history of the U.S. federal minimum wage using data compiled by Statista, in both nominal and real (inflation-adjusted) terms. The federal minimum wage was raised to $7.25 per hour in July 2009, where it has remained ever since.
Nominal vs. Real Value
The data we used to create this graphic can be found in the table below.
| Year | Nominal value ($/hour) | Real value ($/hour) |
|---|---|---|
| 1940 | 0.3 | 6.5 |
| 1945 | 0.4 | 6.82 |
| 1950 | 0.75 | 9.64 |
| 1955 | 0.75 | 8.52 |
| 1960 | 1 | 10.28 |
| 1965 | 1.25 | 12.08 |
| 1970 | 1.6 | 12.61 |
| 1975 | 2.1 | 12.04 |
| 1980 | 3.1 | 11.61 |
| 1985 | 3.35 | 9.51 |
| 1990 | 3.8 | 8.94 |
| 1995 | 4.25 | 8.49 |
| 2000 | 5.15 | 9.12 |
| 2005 | 5.15 | 8.03 |
| 2010 | 7.25 | 10.09 |
| 2015 | 7.25 | 9.3 |
| 2018 | 7.25 | 8.78 |
| 2019 | 7.25 | 8.61 |
| 2020 | 7.25 | 8.58 |
| 2021 | 7.25 | 8.24 |
| 2022 | 7.25 | 7.61 |
| 2023 | 7.25 | 7.25 |
What our graphic shows is how inflation has eroded the real value of the U.S. minimum wage over time, despite nominal increases.
For instance, consider the year 1960, when the federal minimum wage was $1 per hour. After accounting for inflation, this would be worth around $10.28 today!
The two lines converge at 2023 because the nominal and real value are identical in present day terms.
Many States Have Their Own Minimum Wage
According to the National Conference of State Legislatures (NCSL), 30 states and Washington, D.C. have implemented a minimum wage that is higher than $7.25.
The following states have adopted the federal minimum: Georgia, Idaho, Indiana, Iowa, Kansas, Kentucky, New Hampshire, North Carolina, North Dakota, Oklahoma, Pennsylvania, Texas, Utah, Wisconsin, and Wyoming.
Meanwhile, the states of Alabama, Louisiana, Mississippi, South Carolina, and Tennessee have no wage minimums, but have to follow the federal minimum.
How Does the U.S. Minimum Wage Rank Globally?
If you found this topic interesting, check out Mapped: Minimum Wage Around the World to see which countries have the highest minimum wage in monthly terms, as of January 2023.

-

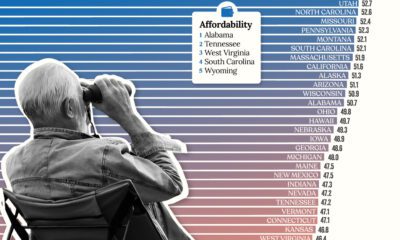
 Real Estate2 weeks ago
Visualizing America’s Shortage of Affordable Homes
-

 Technology1 week ago
Ranked: Semiconductor Companies by Industry Revenue Share
-

 Money1 week ago
Which States Have the Highest Minimum Wage in America?
-

 Real Estate1 week ago
Ranked: The Most Valuable Housing Markets in America
-

 Business2 weeks ago
Charted: Big Four Market Share by S&P 500 Audits
-

 AI2 weeks ago
The Stock Performance of U.S. Chipmakers So Far in 2024
-

 Misc2 weeks ago
Almost Every EV Stock is Down After Q1 2024
-

 Money2 weeks ago
Where Does One U.S. Tax Dollar Go?