Politics
Visualizing the State of Democracy, by Country
View the full-sized interactive version of this graphic
Visualizing the State of Democracy, by Country
View the full-sized interactive version of this infographic by clicking here
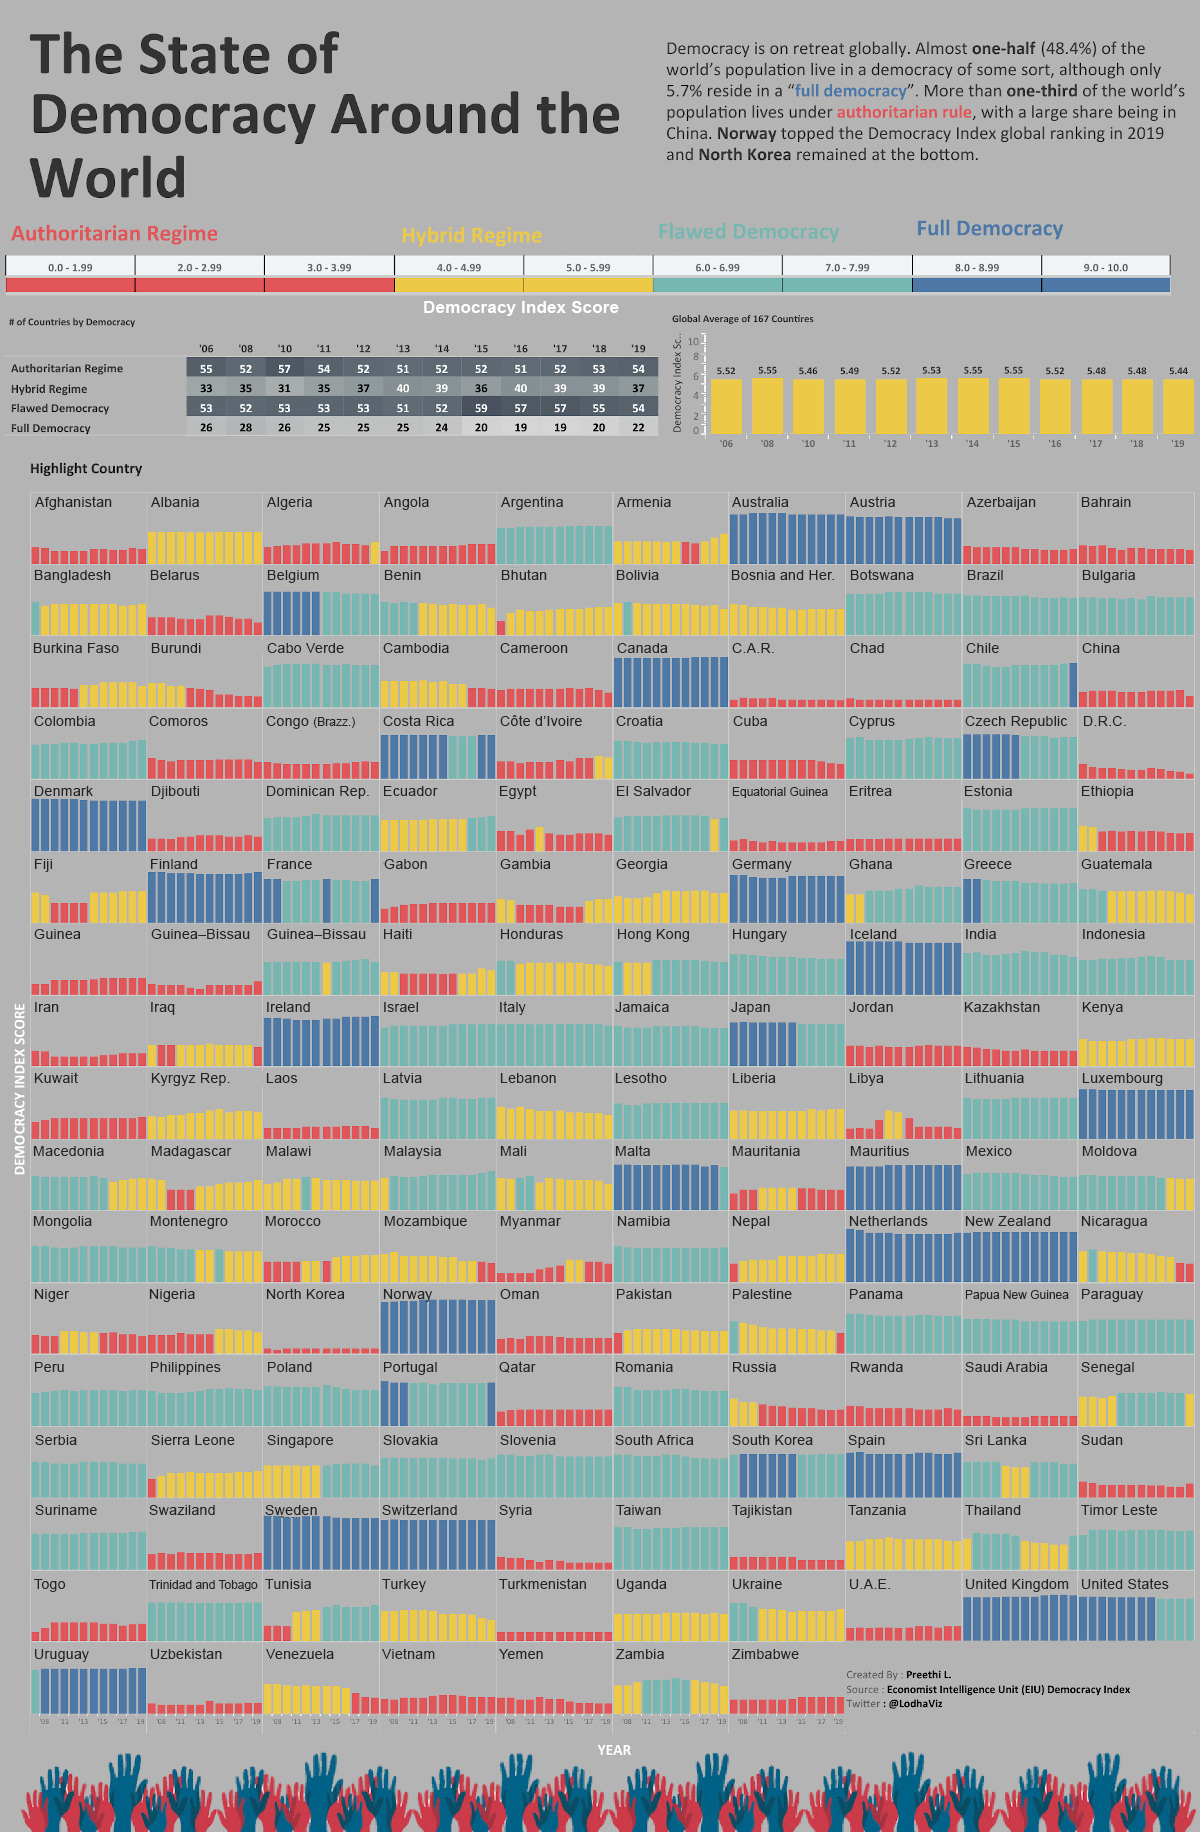
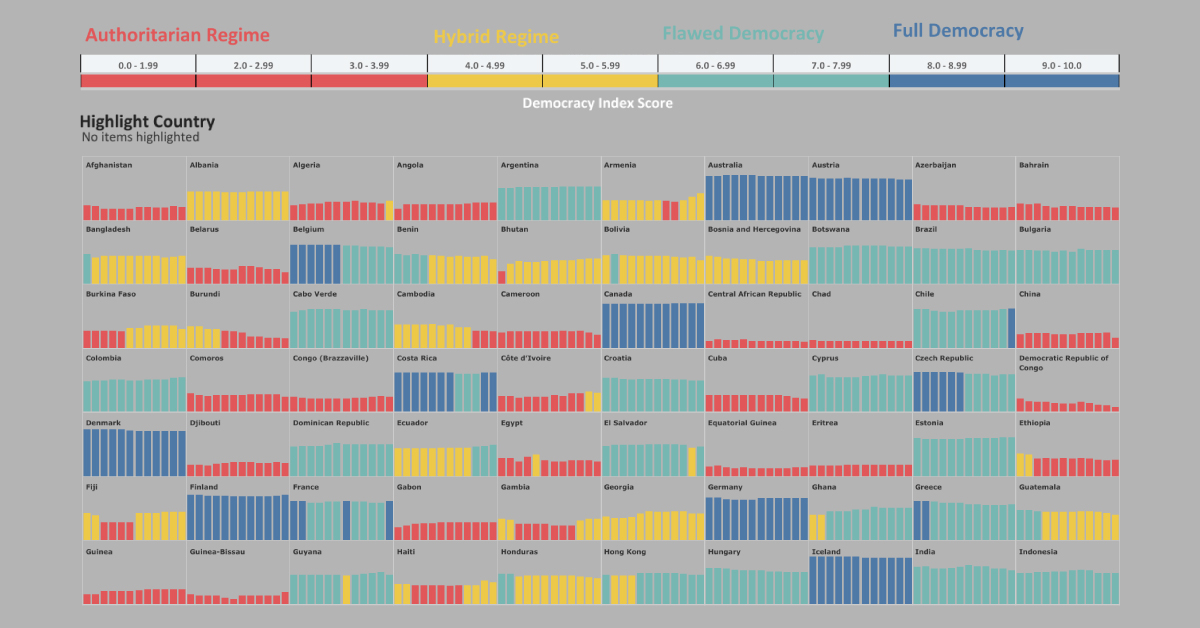
From Norway to North Korea, governing systems differ around the world. But has the world become more or less free in the past decade?
This visualization from Preethi Lodha demonstrates how democracy levels of 167 countries have changed since 2006. The original data comes from the Democracy Index, which is compiled annually by the Economist Intelligence Unit.
Four Levels of Democracy
First, it’s important to understand the classifications made by the Democracy Index.
Based on answers to 60 questions across a nation’s electoral process, civil liberties, government functions, political participation and political culture, countries are assigned a range of scores in the Democracy Index.
Based on these scores, a nation automatically falls into one of the following four types of governance. Here’s which category fits the bill, depending on the range of scores:
| Governance Type | Description | Example | Democracy Index Score |
|---|---|---|---|
| Authoritarian Regime | Nations which exhibit frequent infringements of civil liberties, unfair elections, and rampant censorship. | 🇨🇳 China 🇰🇵 North Korea 🇦🇪 UAE | 0.0-3.99 |
| Hybrid Regime | Nations with regular electoral fraud, corruption, and low political participation, and suppressed opposition. | 🇰🇪 Kenya 🇵🇰 Pakistan 🇹🇷 Turkey | 4.0-5.99 |
| Flawed Democracy | Nations with fair elections, underdeveloped political participation and culture, with minor issues in civil liberty and government functions. | 🇧🇷 Brazil 🇮🇳 India 🇺🇸 U.S. | 6.0-7.99 |
| Full Democracy | Nations where political freedoms are respected with limited problems, governmental checks and balances, and diverse media exist. | 🇦🇺 Australia 🇨🇦 Canada 🇳🇴 Norway | 8.0-10.0 |
One thing that stands out is that many hybrid regimes and flawed democracies are also considered high potential emerging markets, but are held back by their political instability.
Notable Improvements
In recent times, public demonstrations have been a major cause behind increases in Democracy Index scores and changes in governance classifications.
Algeria moved from authoritarian to hybrid regime in 2019, the only country in the Arab region to do so in the index. This came after sustained protests against the previous president, Abdelaziz Bouteflika—who had served for 20 years.
Chile experienced similar turmoil, for the better. After a spike in the scale of middle class unrest over inequality and unfair policies in late 2019, the political participation moved it up from a flawed to full democracy.
Sliding Countries
The U.S. has one of the oldest democracies in the world. However, it was downgraded from a full to a flawed democracy as of the 2016 index, a status that had been “teetering” since before then, according to the report that year.
Venezuela dropped into an authoritarian regime in 2017, and it doesn’t seem to be improving anytime soon. The state was found to use the COVID-19 pandemic as an excuse to crack down on any dissent against the government.
Global Change in Democracy Levels
All in all, the average global democracy score worldwide emerged at 5.48 in 2019, although it’s clear that certain countries pull this value towards the opposite extremes.
North Korea, an authoritarian regime with a 1.08 score, has remained consistently one of the lowest ranked countries in the index. Meanwhile, its alphabetical successor Norway steadily keeps up its high score streak, with 9.87 being the best example of a full democracy in 2019.
Here’s how many countries made up each system of governance over the years, and the global Democracy Index score for that year.
| Year | Authoritarian | Hybrid | Flawed Democracy | Full Democracy | Score |
|---|---|---|---|---|---|
| 2006 | 55 | 33 | 53 | 26 | 5.52 |
| 2008 | 52 | 35 | 52 | 28 | 5.55 |
| 2010 | 57 | 31 | 53 | 26 | 5.46 |
| 2011 | 54 | 35 | 53 | 25 | 5.49 |
| 2012 | 52 | 37 | 53 | 25 | 5.52 |
| 2013 | 51 | 40 | 51 | 25 | 5.53 |
| 2014 | 52 | 39 | 52 | 24 | 5.55 |
| 2015 | 52 | 36 | 59 | 20 | 5.55 |
| 2016 | 51 | 40 | 57 | 19 | 5.52 |
| 2017 | 52 | 39 | 57 | 19 | 5.48 |
| 2018 | 53 | 39 | 55 | 20 | 5.48 |
| 2019 | 54 | 37 | 54 | 22 | 5.48 |
Authoritarian regimes peaked in 2010 with 57 countries, whereas the full democracy category peaked in 2008 with 28 countries.
Since 2006, the average global score has slid from 5.52 to 5.48, and the total of countries categorized under full democracy decreased from 26 to 22.
Does this signal an increasingly divided world? And will the global pandemic—which is already delaying elections—have a further pronounced effect on backsliding these democracy scores?


War
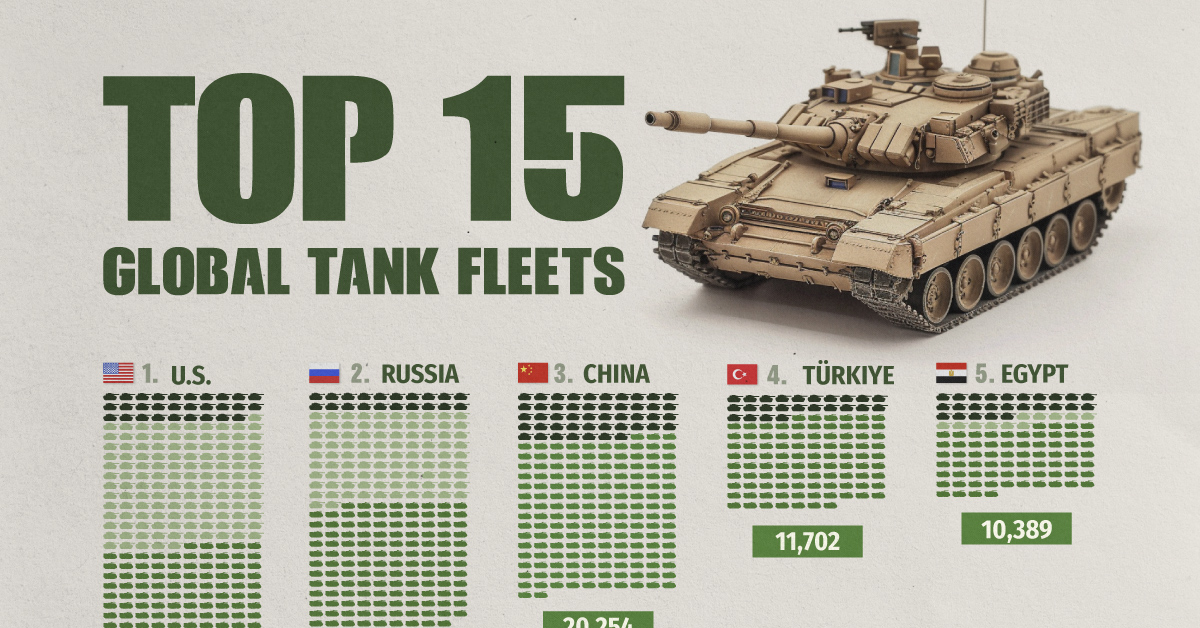
Visualized: Top 15 Global Tank Fleets
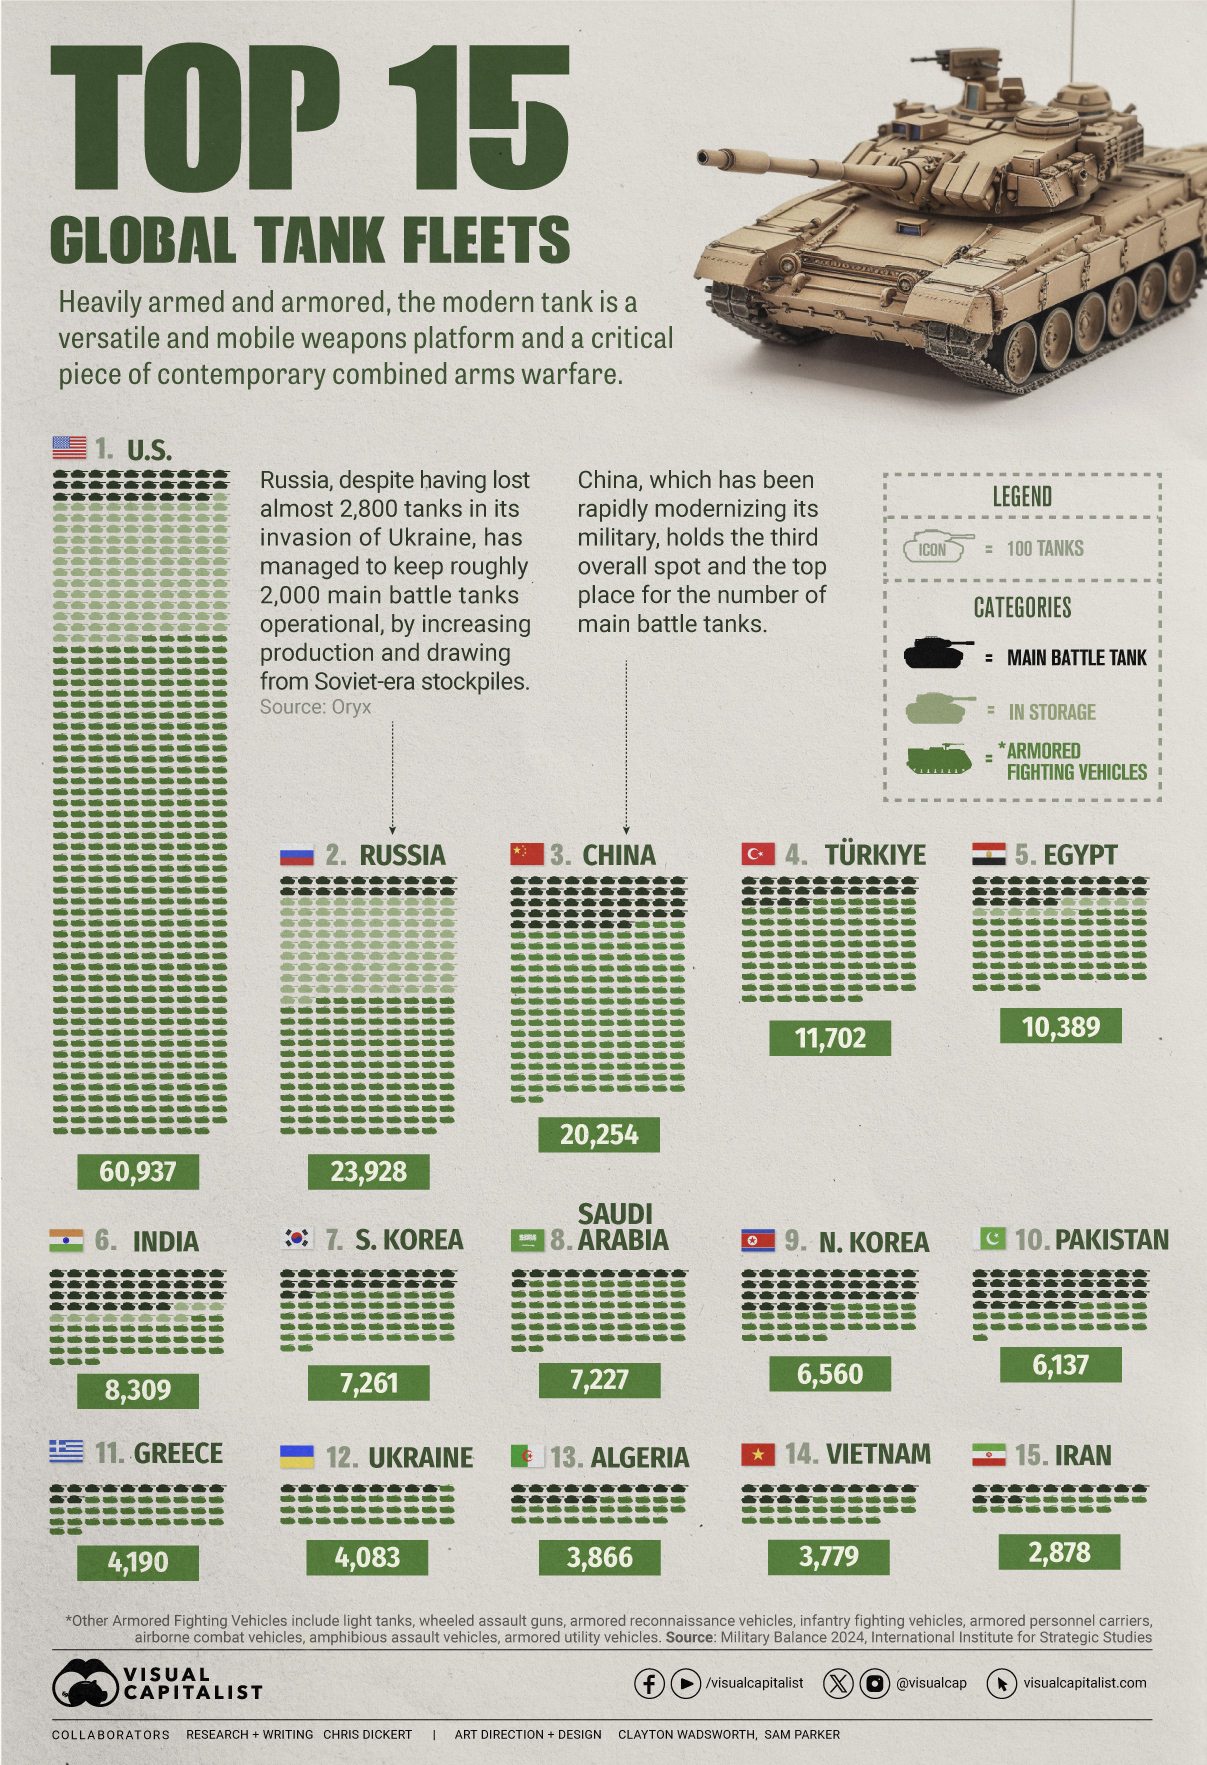
Heavily armed and armored, the modern tank is a versatile and mobile weapons platform, and a critical piece of contemporary warfare.
The Top 15 Global Tank Fleets
This was originally posted on our Voronoi app. Download the app for free on iOS or Android and discover incredible data-driven charts from a variety of trusted sources.
Heavily armed and armored, the modern tank is a versatile and mobile weapons platform, and a critical piece of contemporary warfare.
This visualization shows the top 15 global tank fleets, using data from the 2024 Military Balance report from the International Institute for Strategic Studies (IISS).
Let’s take an in-depth look at the top three fleets:
1. United States
As the world’s pre-eminent military power, it’s perhaps no surprise that the United States also has the largest tank fleet, by a wide margin.
In total, they have just over 45,000 armored fighting vehicles in operation, along with 2,640 main battle tanks (MBTs), and 12,800 vehicles in storage, of which 2,000 are main battle tanks.
| Category | Vehicles | Global rank |
|---|---|---|
| Main battle tanks | 2,640 | 4 |
| Armored reconnaissance | 1,745 | 1 |
| Infantry fighting vehicles | 3,262 | 3 |
| Armored personnel carriers | 10,644 | 1 |
| Amphibious assault vehicles | 1,401 | 1 |
| Armored utility vehicles | 28,445 | 1 |
| Storage | 12,800 | 1 |
| Total | 60,937 | 1 |
The U.S. is internalizing the lessons from the ongoing invasion of Ukraine, where Western-supplied anti-tank weapons and massed Ukrainian artillery have been cutting Russian tanks to pieces. As a result, the U.S. recently canceled an upgrade of the M1 Abrams in favor of a more ambitious upgrade.
Meanwhile, the U.S. is nervously eyeing a more confident China and a potential clash over Taiwan, where air and naval forces will be critical. However, a recent war game showed that Taiwanese mechanized ground forces, kitted out with American-made tanks and armored fighting vehicles, were critical in keeping the island autonomous.
2. Russia
According to Oryx, a Dutch open-source intelligence defense website, at time of writing, Russia has lost almost 2,800 main battle tanks since invading Ukraine. Considering that in the 2022 edition of the Military Balance, Russia was estimated to have 2,927 MBTs in operation, those are some hefty losses.
Russia has been able to maintain about 2,000 MBTs in the field, in part, by increasing domestic production. Many defense plants have been taken over by state-owned Rostec and now operate around the clock. Russia is also now spending a full third of their budget on defense, equivalent to about 7.5% of GDP.
At the same time, they’ve also been drawing down their Soviet-era stockpiles, which are modernized before being sent to the front. Just how long they can keep this up is an open question; their stockpiles are large, but not limitless. Here is what their storage levels look like:
| Category | 2023 | 2024 | YOY change |
|---|---|---|---|
| Main battle tanks | 5,000 | 4,000 | -20.0% |
| Armored reconnaissance | 1,000 | 100 | -90.0% |
| Infantry fighting vehicles | 4,000 | 2,800 | -30.0% |
| Armored personnel carriers | 6,000 | 2,300 | -61.7% |
| Total | 16,000 | 9,200 | -42.5% |
3. China
China holds the third overall spot and top place globally for the number of main battle tanks in operation. Untypically, the People’s Liberation Army has no armored vehicles in storage, which perhaps isn’t surprising when you consider that China has been rapidly modernizing its military and that stockpiles usually contain older models.
China also has one of the world’s largest fleets of armored fighting vehicles, second only to the United States. Breaking down that headline number, we can also see that they have the largest number of light tanks, wheeled guns, and infantry fighting vehicles.
| Category | Vehicles | Global rank |
|---|---|---|
| Main battle tanks | 4,700 | 1 |
| Light tanks | 1,330 | 1 |
| Wheeled guns | 1,250 | 1 |
| Infantry fighting vehicles | 8,200 | 1 |
| Armored personnel carriers | 3,604 | 5 |
| Airborne combat vehicles | 180 | 2 |
| Amphibious assault vehicles | 990 | 2 |
| Total | 20,254 | 3 |
This is equipment that would be integral if China were to make an attempt to reunify Taiwan with the mainland by force, where lightly armored mechanized units need to move with speed to occupy the island before Western allies can enter the fray. It’s worth noting that China also has one of the world’s largest fleets of amphibious assault vehicles.
End of the Tank?
Many commentators at the outset of Russia’s invasion of Ukraine, were quick to predict the end of the tank, however, to paraphrase Mark Twain, reports of the tank’s demise are greatly exaggerated.
With the U.S. and China both developing remote and autonomous armored vehicles, tanks could be quite different in the future, but there is nothing else that matches them for firepower, mobility, and survivability on the modern battlefield today.

-

 Green1 week ago
Ranked: The Countries With the Most Air Pollution in 2023
-

 Automotive2 weeks ago
Almost Every EV Stock is Down After Q1 2024
-

 AI2 weeks ago
The Stock Performance of U.S. Chipmakers So Far in 2024
-

 Markets2 weeks ago
Charted: Big Four Market Share by S&P 500 Audits
-

 Real Estate2 weeks ago
Ranked: The Most Valuable Housing Markets in America
-

 Money2 weeks ago
Which States Have the Highest Minimum Wage in America?
-

 AI2 weeks ago
Ranked: Semiconductor Companies by Industry Revenue Share
-

 Travel2 weeks ago
Ranked: The World’s Top Flight Routes, by Revenue