Politics
Visualizing the State of Democracy, by Country
View the full-sized interactive version of this graphic
Visualizing the State of Democracy, by Country
View the full-sized interactive version of this infographic by clicking here
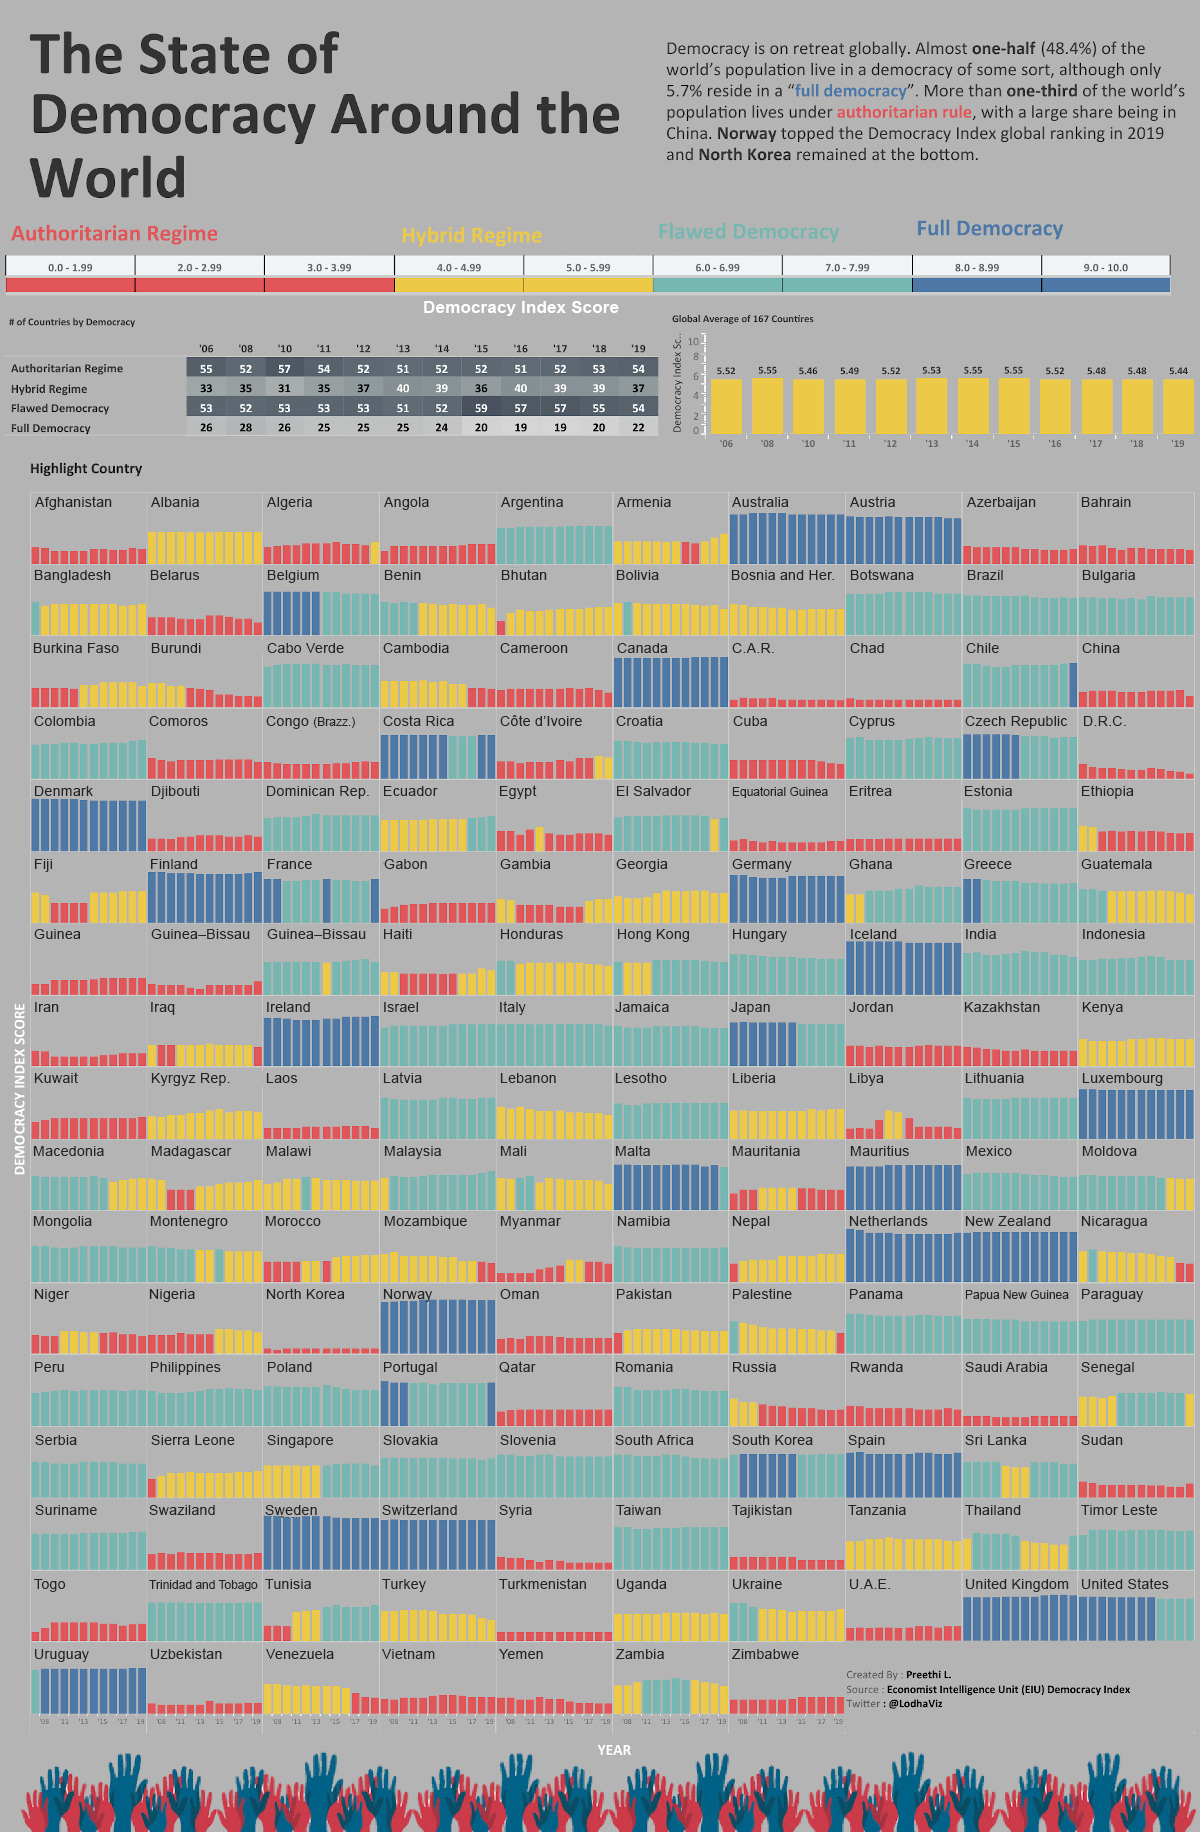
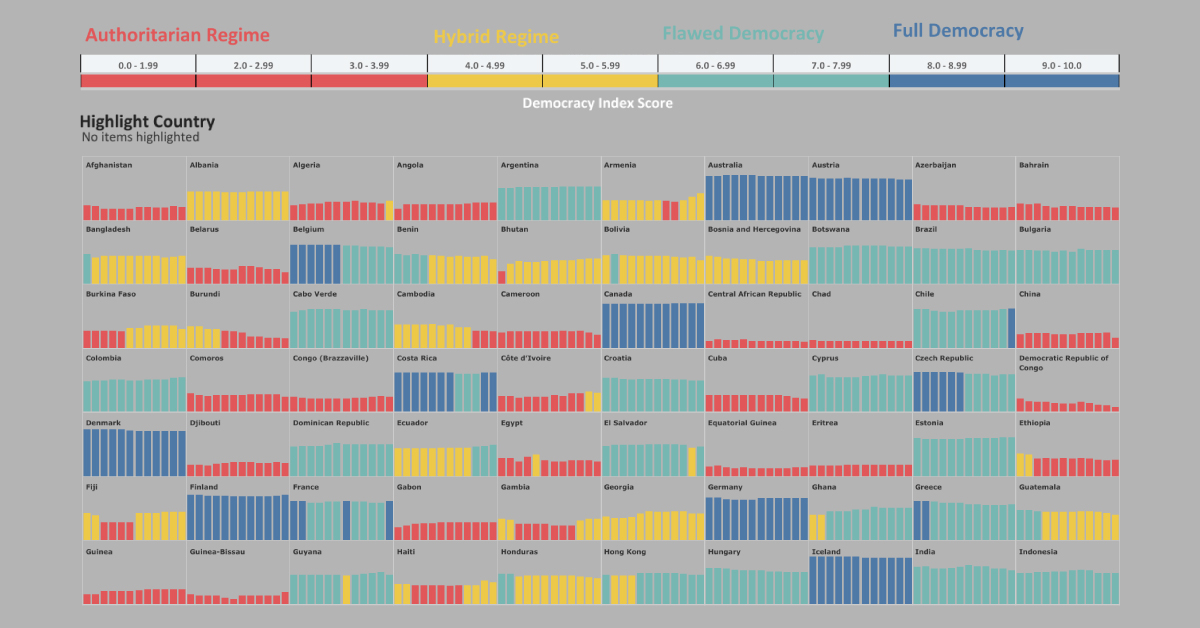
From Norway to North Korea, governing systems differ around the world. But has the world become more or less free in the past decade?
This visualization from Preethi Lodha demonstrates how democracy levels of 167 countries have changed since 2006. The original data comes from the Democracy Index, which is compiled annually by the Economist Intelligence Unit.
Four Levels of Democracy
First, it’s important to understand the classifications made by the Democracy Index.
Based on answers to 60 questions across a nation’s electoral process, civil liberties, government functions, political participation and political culture, countries are assigned a range of scores in the Democracy Index.
Based on these scores, a nation automatically falls into one of the following four types of governance. Here’s which category fits the bill, depending on the range of scores:
| Governance Type | Description | Example | Democracy Index Score |
|---|---|---|---|
| Authoritarian Regime | Nations which exhibit frequent infringements of civil liberties, unfair elections, and rampant censorship. | 🇨🇳 China 🇰🇵 North Korea 🇦🇪 UAE | 0.0-3.99 |
| Hybrid Regime | Nations with regular electoral fraud, corruption, and low political participation, and suppressed opposition. | 🇰🇪 Kenya 🇵🇰 Pakistan 🇹🇷 Turkey | 4.0-5.99 |
| Flawed Democracy | Nations with fair elections, underdeveloped political participation and culture, with minor issues in civil liberty and government functions. | 🇧🇷 Brazil 🇮🇳 India 🇺🇸 U.S. | 6.0-7.99 |
| Full Democracy | Nations where political freedoms are respected with limited problems, governmental checks and balances, and diverse media exist. | 🇦🇺 Australia 🇨🇦 Canada 🇳🇴 Norway | 8.0-10.0 |
One thing that stands out is that many hybrid regimes and flawed democracies are also considered high potential emerging markets, but are held back by their political instability.
Notable Improvements
In recent times, public demonstrations have been a major cause behind increases in Democracy Index scores and changes in governance classifications.
Algeria moved from authoritarian to hybrid regime in 2019, the only country in the Arab region to do so in the index. This came after sustained protests against the previous president, Abdelaziz Bouteflika—who had served for 20 years.
Chile experienced similar turmoil, for the better. After a spike in the scale of middle class unrest over inequality and unfair policies in late 2019, the political participation moved it up from a flawed to full democracy.
Sliding Countries
The U.S. has one of the oldest democracies in the world. However, it was downgraded from a full to a flawed democracy as of the 2016 index, a status that had been “teetering” since before then, according to the report that year.
Venezuela dropped into an authoritarian regime in 2017, and it doesn’t seem to be improving anytime soon. The state was found to use the COVID-19 pandemic as an excuse to crack down on any dissent against the government.
Global Change in Democracy Levels
All in all, the average global democracy score worldwide emerged at 5.48 in 2019, although it’s clear that certain countries pull this value towards the opposite extremes.
North Korea, an authoritarian regime with a 1.08 score, has remained consistently one of the lowest ranked countries in the index. Meanwhile, its alphabetical successor Norway steadily keeps up its high score streak, with 9.87 being the best example of a full democracy in 2019.
Here’s how many countries made up each system of governance over the years, and the global Democracy Index score for that year.
| Year | Authoritarian | Hybrid | Flawed Democracy | Full Democracy | Score |
|---|---|---|---|---|---|
| 2006 | 55 | 33 | 53 | 26 | 5.52 |
| 2008 | 52 | 35 | 52 | 28 | 5.55 |
| 2010 | 57 | 31 | 53 | 26 | 5.46 |
| 2011 | 54 | 35 | 53 | 25 | 5.49 |
| 2012 | 52 | 37 | 53 | 25 | 5.52 |
| 2013 | 51 | 40 | 51 | 25 | 5.53 |
| 2014 | 52 | 39 | 52 | 24 | 5.55 |
| 2015 | 52 | 36 | 59 | 20 | 5.55 |
| 2016 | 51 | 40 | 57 | 19 | 5.52 |
| 2017 | 52 | 39 | 57 | 19 | 5.48 |
| 2018 | 53 | 39 | 55 | 20 | 5.48 |
| 2019 | 54 | 37 | 54 | 22 | 5.48 |
Authoritarian regimes peaked in 2010 with 57 countries, whereas the full democracy category peaked in 2008 with 28 countries.
Since 2006, the average global score has slid from 5.52 to 5.48, and the total of countries categorized under full democracy decreased from 26 to 22.
Does this signal an increasingly divided world? And will the global pandemic—which is already delaying elections—have a further pronounced effect on backsliding these democracy scores?


Economy
The Bloc Effect: International Trade with Geopolitical Allies on the Rise
Rising geopolitical tensions are shaping the future of international trade, but what is the effect on trading among G7 and BRICS countries?


The Bloc Effect: International Trade with Allies on the Rise
International trade has become increasingly fragmented over the last five years as countries have shifted to trading more with their geopolitical allies.
This graphic from The Hinrich Foundation, the first in a three-part series covering the future of trade, provides visual context to the growing divide in trade in G7 and pre-expansion BRICS countries, which are used as proxies for geopolitical blocs.
Trade Shifts in G7 and BRICS Countries
This analysis uses IMF data to examine differences in shares of exports within and between trading blocs from 2018 to 2023. For example, we looked at the percentage of China’s exports with other BRICS members as well as with G7 members to see how these proportions shifted in percentage points (pp) over time.
Countries traded nearly $270 billion more with allies in 2023 compared to 2018. This shift came at the expense of trade with rival blocs, which saw a decline of $314 billion.
Country Change in Exports Within Bloc (pp) Change in Exports With Other Bloc (pp)
🇮🇳 India 0.0 3.9
🇷🇺 Russia 0.7 -3.8
🇮🇹 Italy 0.8 -0.7
🇨🇦 Canada 0.9 -0.7
🇫🇷 France 1.0 -1.1
🇪🇺 EU 1.1 -1.5
🇩🇪 Germany 1.4 -2.1
🇿🇦 South Africa 1.5 1.5
🇺🇸 U.S. 1.6 -0.4
🇯🇵 Japan 2.0 -1.7
🇨🇳 China 2.1 -5.2
🇧🇷 Brazil 3.7 -3.3
🇬🇧 UK 10.2 0.5
All shifts reported are in percentage points. For example, the EU saw its share of exports to G7 countries rise from 74.3% in 2018 to 75.4% in 2023, which equates to a 1.1 percentage point increase.
The UK saw the largest uptick in trading with other countries within the G7 (+10.2 percentage points), namely the EU, as the post-Brexit trade slump to the region recovered.
Meanwhile, the U.S.-China trade dispute caused China’s share of exports to the G7 to fall by 5.2 percentage points from 2018 to 2023, the largest decline in our sample set. In fact, partly as a result of the conflict, the U.S. has by far the highest number of harmful tariffs in place.
The Russia-Ukraine War and ensuing sanctions by the West contributed to Russia’s share of exports to the G7 falling by 3.8 percentage points over the same timeframe.
India, South Africa, and the UK bucked the trend and continued to witness advances in exports with the opposing bloc.
Average Trade Shifts of G7 and BRICS Blocs
Though results varied significantly on a country-by-country basis, the broader trend towards favoring geopolitical allies in international trade is clear.
Bloc Change in Exports Within Bloc (pp) Change in Exports With Other Bloc (pp)
Average 2.1 -1.1
BRICS 1.6 -1.4
G7 incl. EU 2.4 -1.0
Overall, BRICS countries saw a larger shift away from exports with the other bloc, while for G7 countries the shift within their own bloc was more pronounced. This implies that though BRICS countries are trading less with the G7, they are relying more on trade partners outside their bloc to make up for the lost G7 share.
A Global Shift in International Trade and Geopolitical Proximity
The movement towards strengthening trade relations based on geopolitical proximity is a global trend.
The United Nations categorizes countries along a scale of geopolitical proximity based on UN voting records.
According to the organization’s analysis, international trade between geopolitically close countries rose from the first quarter of 2022 (when Russia first invaded Ukraine) to the third quarter of 2023 by over 6%. Conversely, trade with geopolitically distant countries declined.
The second piece in this series will explore China’s gradual move away from using the U.S. dollar in trade settlements.
Visit the Hinrich Foundation to learn more about the future of geopolitical trade

-

 Economy2 hours ago
Economic Growth Forecasts for G7 and BRICS Countries in 2024
The IMF has released its economic growth forecasts for 2024. How do the G7 and BRICS countries compare?
-

 United States1 week ago
Ranked: The Largest U.S. Corporations by Number of Employees
We visualized the top U.S. companies by employees, revealing the massive scale of retailers like Walmart, Target, and Home Depot.
-

 Economy2 weeks ago
Where U.S. Inflation Hit the Hardest in March 2024
We visualized product categories that saw the highest % increase in price due to U.S. inflation as of March 2024.
-

 Economy4 weeks ago
G20 Inflation Rates: Feb 2024 vs COVID Peak
We visualize inflation rates across G20 countries as of Feb 2024, in the context of their COVID-19 pandemic peak.
-

 Economy1 month ago
Mapped: Unemployment Claims by State
This visual heatmap of unemployment claims by state highlights New York, California, and Alaska leading the country by a wide margin.
-

 Economy2 months ago
Confidence in the Global Economy, by Country
Will the global economy be stronger in 2024 than in 2023?


-

 Markets1 week ago
U.S. Debt Interest Payments Reach $1 Trillion
-

 Business2 weeks ago
Charted: Big Four Market Share by S&P 500 Audits
-

 Real Estate2 weeks ago
Ranked: The Most Valuable Housing Markets in America
-

 Money2 weeks ago
Which States Have the Highest Minimum Wage in America?
-

 AI2 weeks ago
Ranked: Semiconductor Companies by Industry Revenue Share
-

 Markets2 weeks ago
Ranked: The World’s Top Flight Routes, by Revenue
-

 Demographics2 weeks ago
Population Projections: The World’s 6 Largest Countries in 2075
-

 Markets2 weeks ago
The Top 10 States by Real GDP Growth in 2023