The U.S. Utilities Decarbonization Index
Introducing the NPUC Annual Utility Decarbonization Report 2022
Created in partnership by Visual Capitalist and Motive Power.
The U.S. Utilities Decarbonization Index
With the Biden administration targeting a zero-emissions power sector for the U.S. by 2035, how are the nation’s largest electric power providers faring in terms of decarbonization?
Together, Visual Capitalist and our sponsor National Public Utilities Council have developed the Annual Utility Decarbonization Index. The index quantifies and compares the status of decarbonization among the 30 largest investor-owned utilities in the United States.
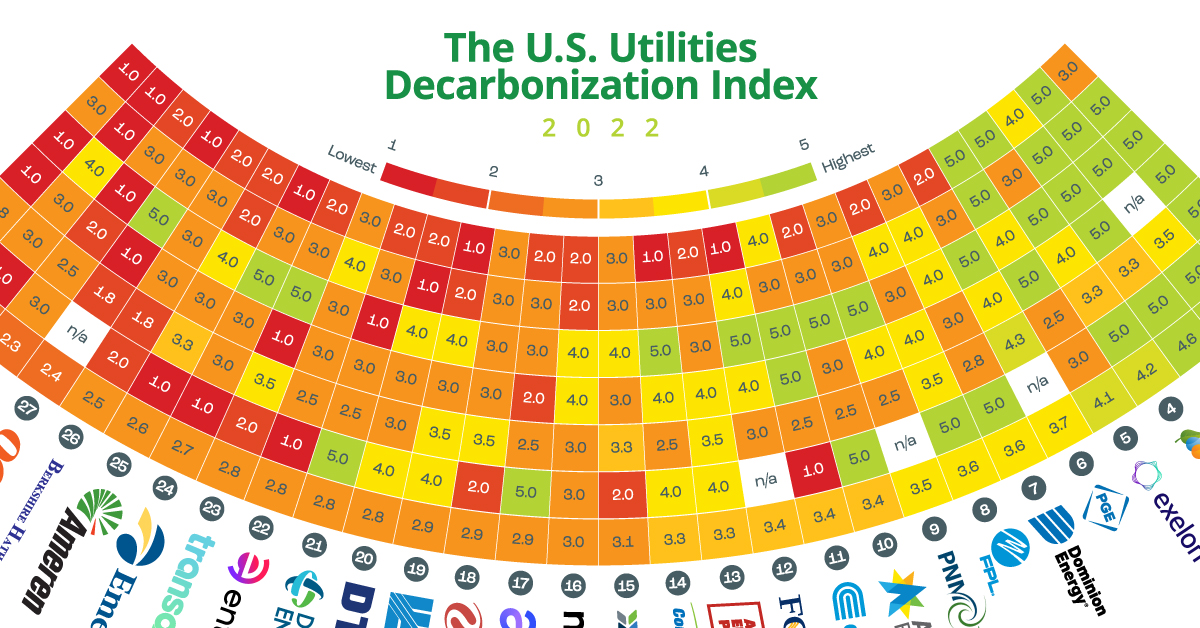
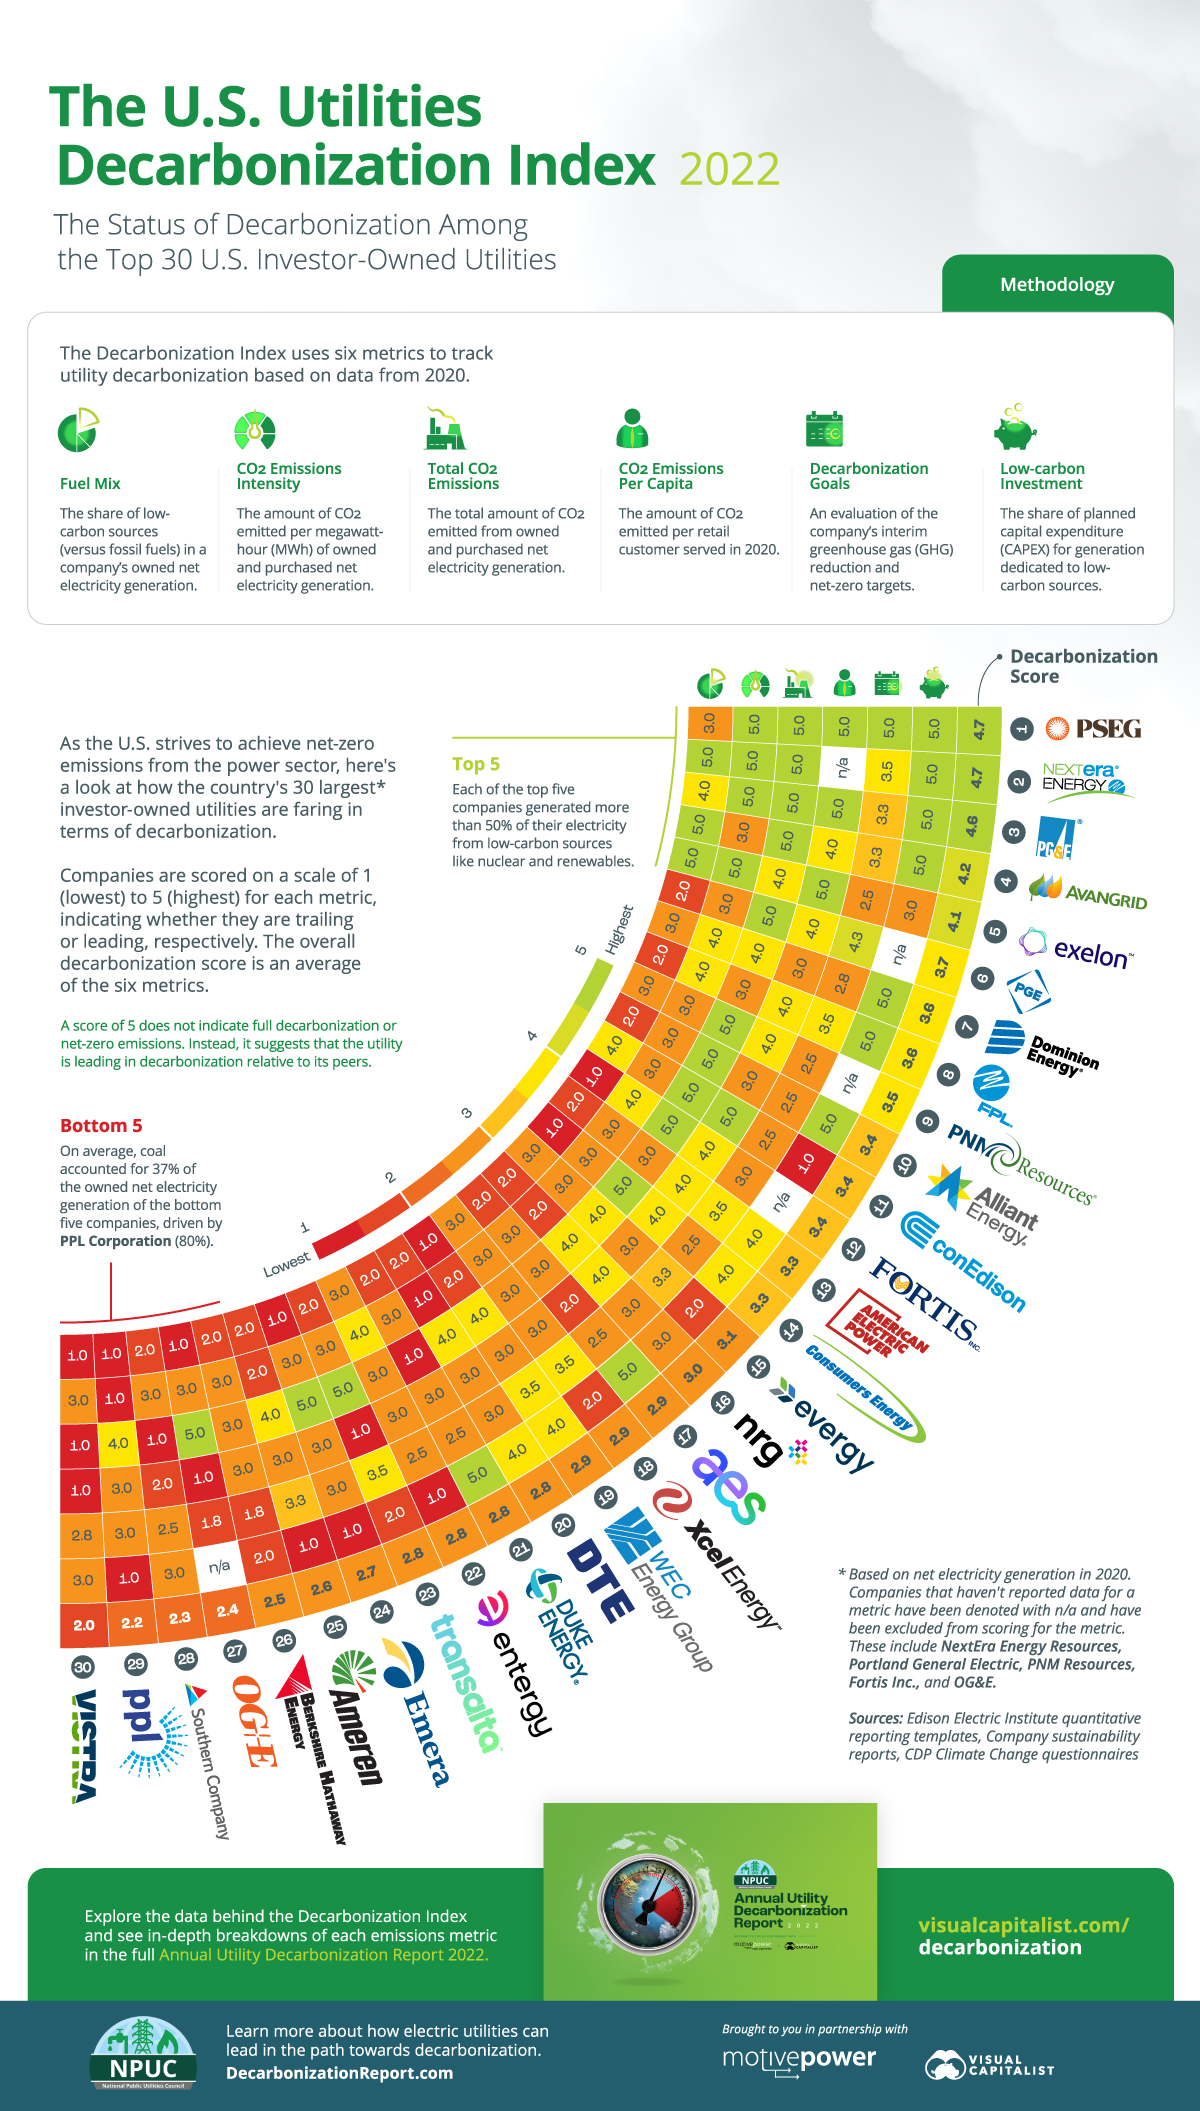
Decarbonization is quantified by scoring companies on six emissions-related metrics based on publicly available data from 2020 (the latest available).
Why the 30 Largest IOUs?
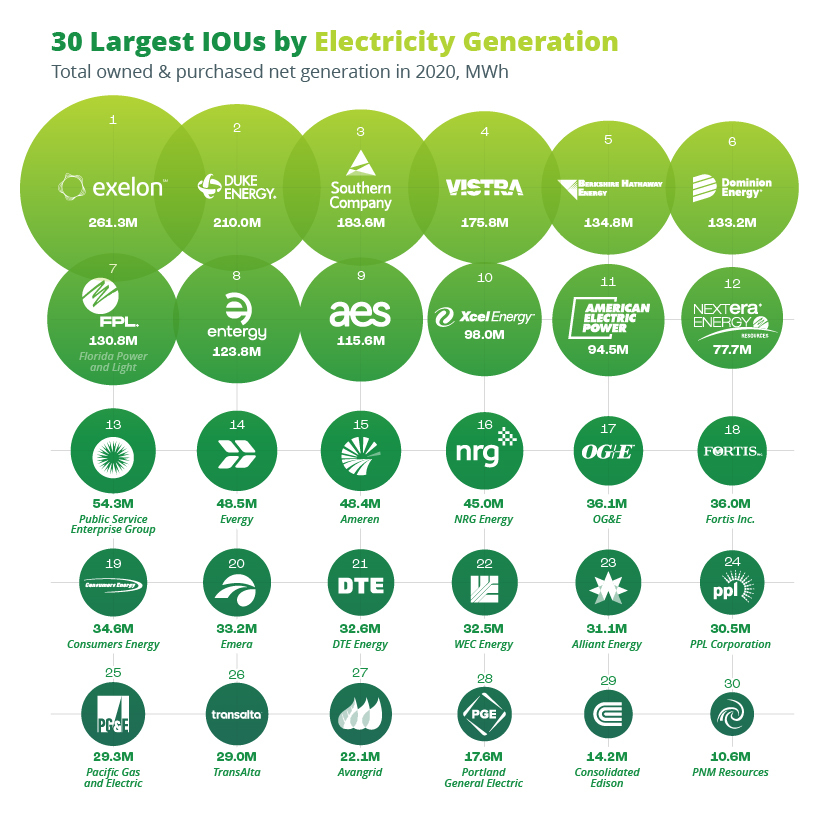
Why does the Decarbonization Index specifically look at the 30 largest IOUs by electricity generation?
Well, these 30 utilities collectively generated around 2.3 billion megawatt hours (MWh) of electricity (including purchased power), making up over half of U.S. net electricity generation in 2020. Moreover, they also served over 90 million customers, accounting for roughly 56% of all electric customers in the country.
Therefore, it’s safe to say that the 30 largest IOUs have an important role in decarbonizing both the power sector and the U.S. economy. Since the residential, commercial, industrial, and agricultural sectors all use electricity, the decarbonization of utilities—the providers of electric power—can enable emissions reduction throughout the economy.
Decarbonization Index Methodology
For each of the six metrics used in the Decarbonization Index, utilities are scored on a scale of 1 (lowest) to 5 (highest), indicating whether they are trailing or leading, respectively. Scores for each metric are based on the range of figures for each metric divided into five equal buckets that the utilities fall into.
For simplicity, let’s suppose that the lowest reported total emissions figure is zero metric tons of carbon dioxide (CO2) and the highest is 100 metric tons. In that case, companies that emit fewer than 20 metric tons of CO2 will receive the highest score of 5. Those that emit between 20 and 40 metric tons of CO2 will receive a 4, and so on.
A utility’s overall decarbonization score is an average of their scores across the six metrics, summarized below:
- Fuel Mix:
The share of low-carbon sources (renewables, nuclear, and fuel cells) in the utility’s owned net electricity generation. We’ve assumed that the share of low-carbon sources can range from 0% to 100%, and scores are assigned based on that range. - CO2 Emissions Intensity:
The amount of CO2 emitted per megawatt-hour of owned and purchased electricity generation. - Total CO2 Emissions:
The sum of absolute CO2 emissions from owned and purchased electricity generation. While this overlooks the differing sizes of utilities, the rationale is that smaller unconsolidated utilities may find it easier to decarbonize than larger peers. - CO2 Emissions per Capita:
The amount of CO2 emitted from owned and purchased electricity generation per retail customer served in 2020. - Decarbonization Goals:
An evaluation of the utility’s interim greenhouse gas (GHG) emissions reduction goals and net-zero targets. The baseline for this is 50% GHG emissions reduction by 2030 and net-zero emissions by 2050 (utilities with baseline targets get a score of 2.5/5). - Low-Carbon Investment:
The share of planned capital expenditure (CAPEX) for electricity generation that is allocated to low-carbon sources. We’ve assumed that the share of CAPEX for low-carbon sources can range from 0% to 100%, and scores are assigned based on that range.
The data for these metrics comes from various sources including company sustainability reports, quantitative reporting templates from the Edison Electric Institute, and the Climate Disclosure Project’s Climate Change Questionnaire filings.
Explore all six metrics of the U.S. Utility Decarbonization Index
Download The NPUC Annual Utility Decarbonization Report for free.
The Annual Utility Decarbonization Index 2022
Before looking at numbers, it’s important to note that the Decarbonization Index is relative and compares the 30 largest IOUs to each other. Therefore, a score of 5 does not indicate full decarbonization or net-zero emissions. Instead, it suggests that the utility is doing particularly well relative to its peers.
With that in mind, here’s a look at the Annual Utility Decarbonization Index 2022:
| Rank | Company | Decarbonization Score |
|---|---|---|
| #1 | Public Service Enterprise Group | 4.7 |
| #2 | NextEra Energy Resources | 4.7 |
| #3 | Pacific Gas and Electric | 4.5 |
| #4 | Avangrid | 4.2 |
| #5 | Exelon | 4.1 |
| #6 | Portland General Electric | 3.7 |
| #7 | Dominion Energy | 3.6 |
| #8 | Florida Power and Light | 3.6 |
| #9 | PNM Resources | 3.5 |
| #10 | Alliant Energy | 3.4 |
| #11 | Consolidated Edison | 3.4 |
| #12 | Fortis Inc. | 3.4 |
| #13 | American Electric Power | 3.3 |
| #14 | Consumers Energy | 3.3 |
| #15 | Evergy | 3.0 |
| #16 | NRG Energy | 3.0 |
| #17 | AES Corporation | 2.9 |
| #18 | Xcel Energy | 2.9 |
| #19 | WEC Energy | 2.9 |
| #20 | DTE Energy | 2.8 |
| #21 | Duke Energy | 2.8 |
| #22 | Entergy | 2.8 |
| #23 | TransAlta | 2.8 |
| #24 | Emera | 2.7 |
| #25 | Ameren | 2.6 |
| #26 | Berkshire Hathaway Energy | 2.5 |
| #27 | Oklahoma Gas & Electric Company | 2.4 |
| #28 | Southern Company | 2.3 |
| #29 | PPL Corporation | 2.2 |
| #30 | Vistra Corp. | 2.0 |
A small number of companies did not report data on certain metrics and have been excluded from scoring for those metrics (denoted as N/A). In such cases, the decarbonization score is an average of five metrics instead of six.
Public Service Enterprise Group (PSEG), headquartered in New Jersey, tops this year’s rankings thanks to its low-emissions profile and ambitious climate goals. The company is aiming to achieve net-zero emissions from operations by 2030—five years ahead of the Biden Administration’s target and faster than any other utility on the list.
Tied with PSEG is NextEra Energy Resources, the clean energy-focused subsidiary of NextEra Energy. The company is the world’s largest producer of solar and wind power and generated 97% of its net electricity from low-carbon sources in 2020.
In third place is California’s largest utility, the Pacific Gas and Electric Company (PG&E). PG&E had the lowest emissions per capita of the 30 largest IOUs at 0.5 metric tons of CO2 per retail customer in 2020. That figure is significantly lower than the average of 11.5 metric tons across the 30 IOUs.
Rounding out the top five are Avangrid, a renewables-focused U.S. subsidiary of the Spanish Iberdrola Group, and Exelon, the nation’s largest utility by number of retail customers. Avangrid had one of the cleanest fuel mixes with 87% of its owned net electricity coming from low-carbon sources. Exelon is the nation’s largest provider of emissions-free electricity, generating around 157 million MWh or 86% of its owned net electricity from nuclear power.
Download the Full Utility Decarbonization Report
While the Decarbonization Index provides a look at the current status of utility decarbonization, there’s much more to uncover in the full report, including:
- The obstacles that utilities face on the path to decarbonization
- The detailed data behind the six individual metrics
- The U.S. utilities ESG report card
- The solutions and strategies that can help accelerate decarbonization
>> Click here to download the full report and find out everything you need to know about utility decarbonization.

-

 Energy1 day ago
The World’s Biggest Nuclear Energy Producers
China has grown its nuclear capacity over the last decade, now ranking second on the list of top nuclear energy producers.
-

 Energy3 weeks ago
The World’s Biggest Oil Producers in 2023
Just three countries accounted for 40% of global oil production last year.
-

 Energy1 month ago
How Much Does the U.S. Depend on Russian Uranium?
Currently, Russia is the largest foreign supplier of nuclear power fuel to the U.S.
-

 Uranium2 months ago
Charted: Global Uranium Reserves, by Country
We visualize the distribution of the world’s uranium reserves by country, with 3 countries accounting for more than half of total reserves.
-

 Energy2 months ago
Visualizing the Rise of the U.S. as Top Crude Oil Producer
Over the last decade, the United States has established itself as the world’s top producer of crude oil, surpassing Saudi Arabia and Russia.
-

 Energy3 months ago
2024 U.S. Clean Electricity Outlook
In this graphic, we explore the projected generation capacity of different clean electricity technologies in the U.S. for 2023 and 2024.