Ranked: Harmful Tariffs by Economy

Download the Sustainable Trade Index for free.
Ranked: Harmful Tariffs by Economy
Amid supply chain concerns and geopolitical tension, some economies have taken steps toward localization. More specifically, companies are bringing manufacturing back home and a number of governments have increased tariffs.
This graphic from The Hinrich Foundation, the second in a five-part series on the sustainability of trade, explores which economies have the most and least tariffs. It pulls data from the 2022 Sustainable Trade Index, which The Hinrich Foundation produced in collaboration with the IMD World Competitiveness Center.
What is a Tariff?
A tariff is a tax on imported goods. Tariffs can be beneficial because they are a source of government revenue and help prevent product “dumping”—when exporters price products abroad for less than they are worth in their home country. By adding a tax to imported goods, a tariff can help keep local products competitively priced.
However, taxes on imported goods can also have drawbacks. They are a form of trade protectionism, and can lower economic growth and productivity. In fact, one long-term study found that a 3.6% increase in the tariff rate led to a 0.4% decline in GDP growth five years later.
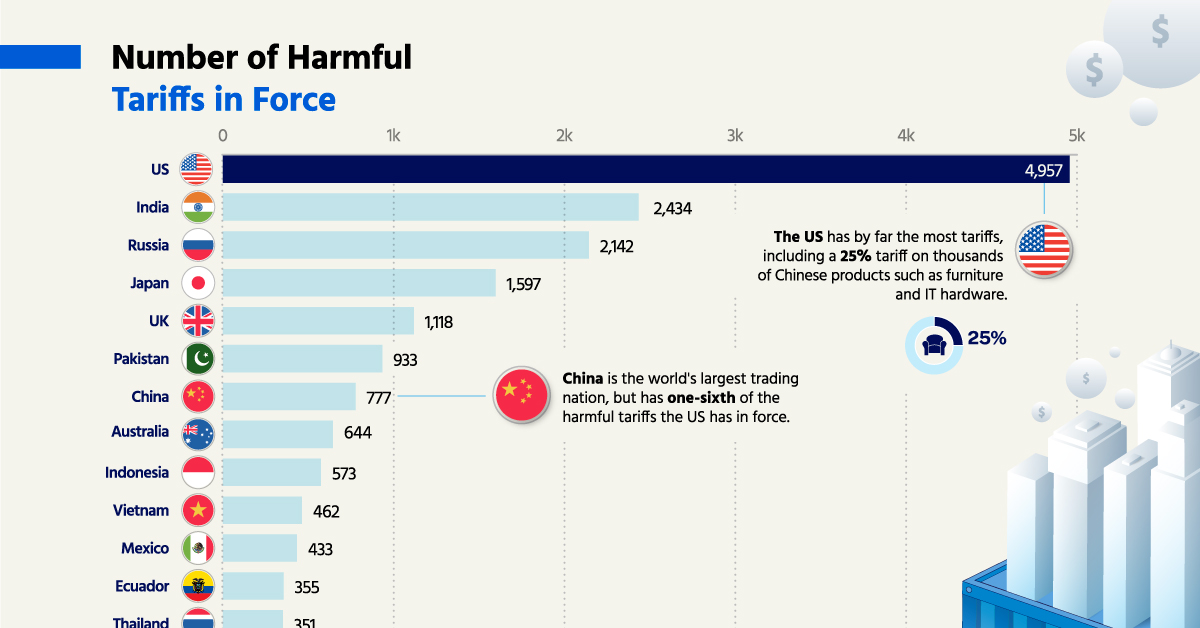
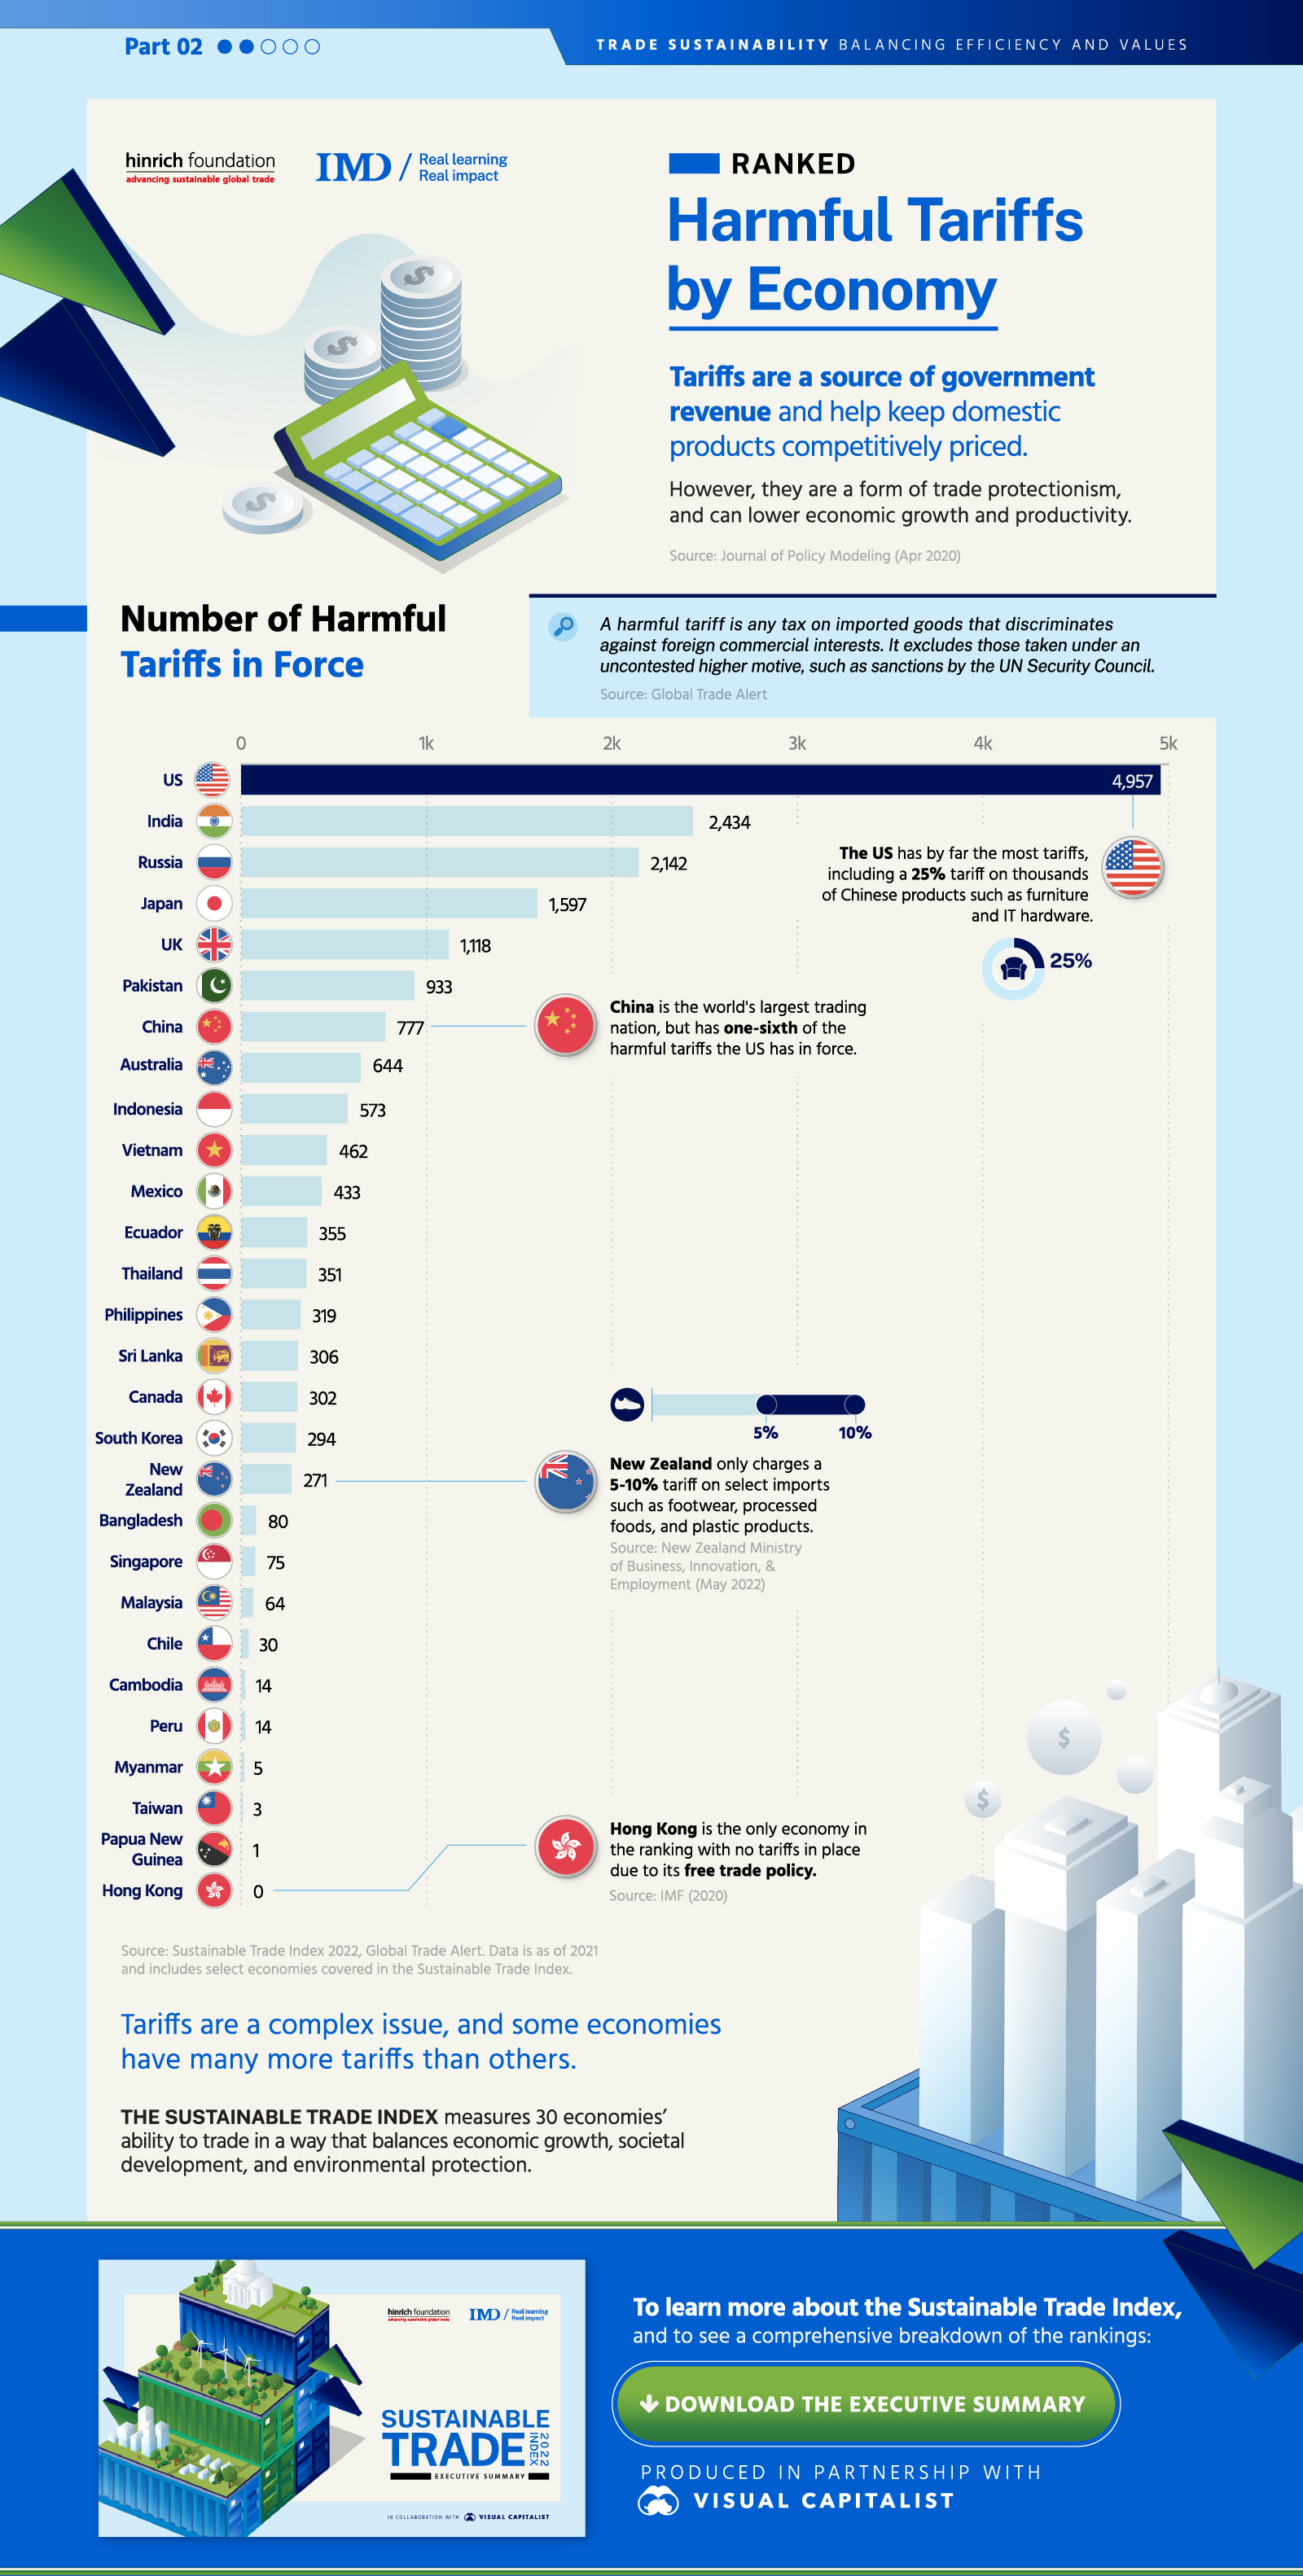
Number of Harmful Tariffs by Economy
For the purposes of this data, a harmful tariff is any tariff that discriminates against foreign commercial interests. It excludes those taken under an uncontested higher motive, such as sanctions by the UN Security Council.
Below, we highlight the number of tariffs in force for select economies covered in the 2022 Sustainable Trade Index.
| Economy | Number of Harmful Tariffs in Force |
|---|---|
| U.S. | 4,957 |
| India | 2,434 |
| Russia | 2,142 |
| Japan | 1,597 |
| UK | 1,118 |
| Pakistan | 933 |
| China | 777 |
| Australia | 644 |
| Indonesia | 573 |
| Vietnam | 462 |
| Mexico | 433 |
| Ecuador | 355 |
| Thailand | 351 |
| Philippines | 319 |
| Sri Lanka | 306 |
| Canada | 302 |
| South Korea | 294 |
| New Zealand | 271 |
| Bangladesh | 80 |
| Singapore | 75 |
| Malaysia | 64 |
| Chile | 30 |
| Cambodia | 14 |
| Peru | 14 |
| Myanmar | 5 |
| Taiwan | 3 |
| Papua New Guinea | 1 |
| Hong Kong | 0 |
The U.S. has by far the most tariffs, partly driven by the China/U.S. trade war that began in 2018. Some Chinese products were subject to a 25% tariff, including auto parts, furniture, and semiconductors. As of August 2022, U.S. imports from China of these heavily taxed products were 22% below pre-trade war levels. On the other hand, U.S. imports of Chinese products not subject to a tariff were 50% higher.
Meanwhile, China retaliated with its own tariffs against U.S. products. However, China still has one-sixth of the harmful tariffs that the U.S. has in force. In the last few decades, the country’s accession to the World Trade Organization and reduced tariff rate contributed to it becoming the world’s largest trading partner.
Want more insights into trade sustainability?
Download the 2022 Sustainable Trade Index for free.
At the other end of the scale, Hong Kong has a free trade policy. It is the only economy in the index with no tariffs. Hong Kong’s economy is highly dependent on trade, and was the sixth-largest trading entity in goods in 2021.
Tariffs and Trade Sustainability
Tariffs are a complex issue, with governments needing to consider the benefits and the drawbacks. Among the Sustainable Trade Index, there is a wide variety in the number of tariffs in force.
The Sustainable Trade Index measures 30 economies’ ability to trade in a way that balances economic growth, societal development, and environmental protection. To learn more, visit the STI landing page where you can download the report for free.
The third piece in this series will explore geopolitical uncertainty by economy, and how this impacts trade and society.

-

 Markets4 days ago
Ranked: The Largest U.S. Corporations by Number of Employees
We visualized the top U.S. companies by employees, revealing the massive scale of retailers like Walmart, Target, and Home Depot.
-

 Economy7 days ago
Where U.S. Inflation Hit the Hardest in March 2024
We visualized product categories that saw the highest % increase in price due to U.S. inflation as of March 2024.
-

 Economy3 weeks ago
G20 Inflation Rates: Feb 2024 vs COVID Peak
We visualize inflation rates across G20 countries as of Feb 2024, in the context of their COVID-19 pandemic peak.
-

 Economy3 weeks ago
Mapped: Unemployment Claims by State
This visual heatmap of unemployment claims by state highlights New York, California, and Alaska leading the country by a wide margin.
-

 Markets1 month ago
Confidence in the Global Economy, by Country
Will the global economy be stronger in 2024 than in 2023?
-

 Maps1 month ago
Mapped: Breaking Down the $3 Trillion African Economy by Country
The top three economic powerhouses of Africa contribute more than one-third to the African economy. We rank the nations of the world’s second-largest continent by 2024…