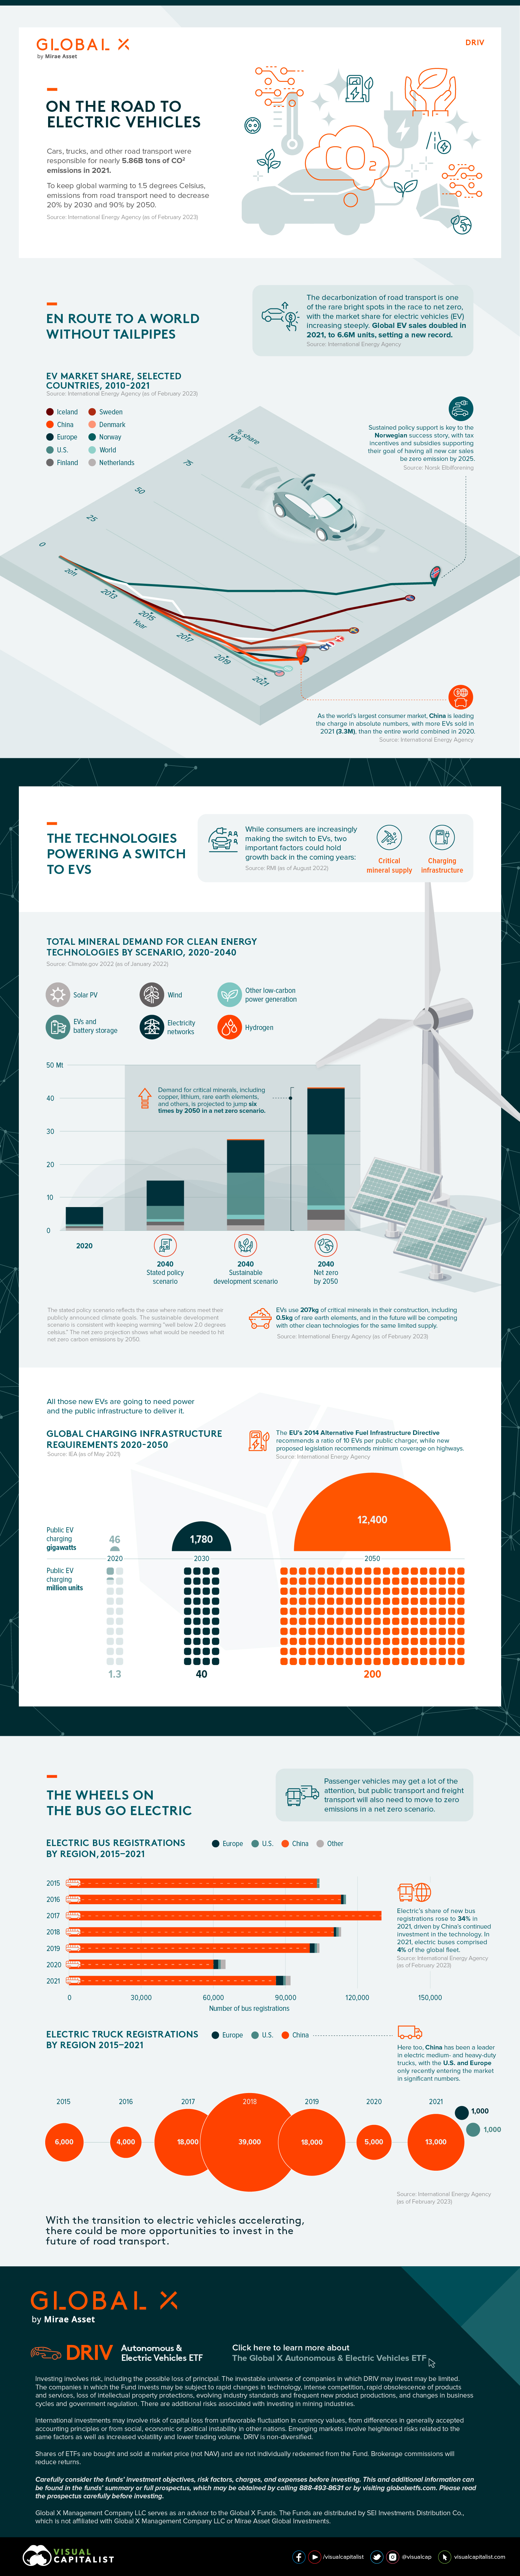
On the Road to Electric Vehicles
On the Road to Electric Vehicles
Electric vehicles are playing a key role in the decarbonization of road transport.
But with cars, trucks, and other road transport responsible for nearly 5.86 billion tons of CO2 emissions in 2021—16.1% of total emissions—there’s still a long road ahead.
To keep global warming to 1.5 degrees Celsius, emissions from road transport need to decrease 20% by 2030 on the way to net zero in 2050.
In this visualization for sponsor Global X ETFs, we’ll examine just how far road transport still needs to go.
A World Without Tailpipes
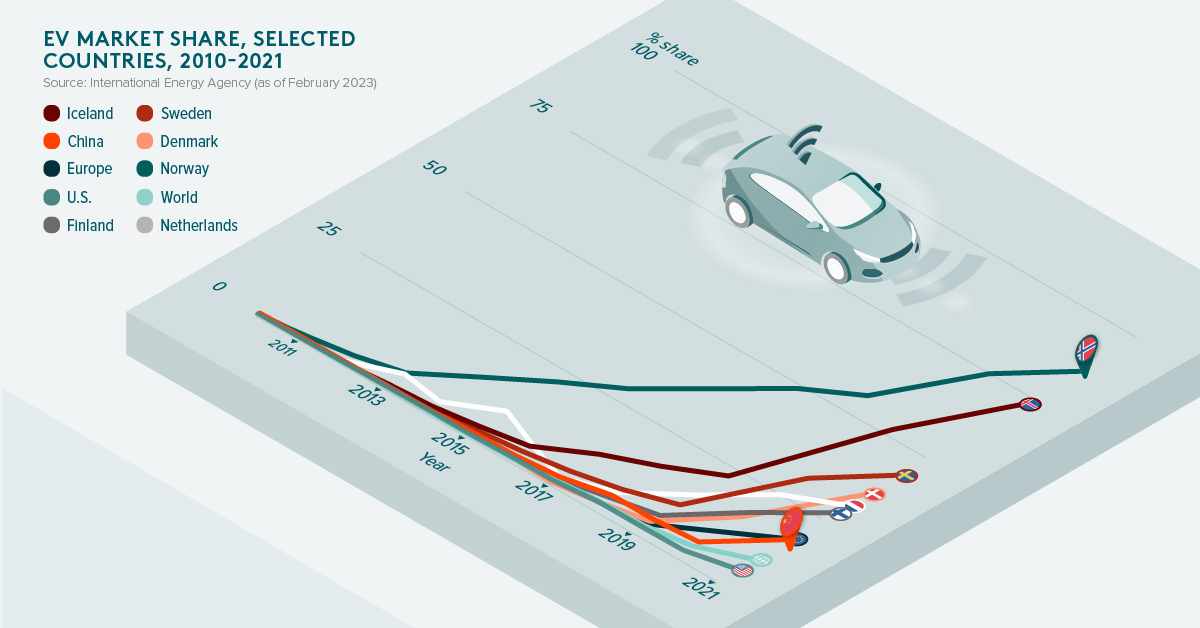
The decarbonization of road transport is one of the rare bright spots in the race to net zero. In 2021, global electric vehicle (EV) sales doubled to 6.6 million units, setting a new all-time record.
| Country or Region | EV Market Share |
|---|---|
| Norway | 86.0% |
| Iceland | 72.0% |
| Sweden | 43.0% |
| Denmark | 35.0% |
| Finland | 31.0% |
| Netherlands | 30.0% |
| Europe | 17.0% |
| China | 16.0% |
| World | 8.6% |
| U.S. | 4.6% |
Scandinavian countries are world leaders in EV sales, by market share. In Norway, for example, EVs are 86% of new car sales, thanks in large part to tax incentives and subsidies. The country has set a goal of having zero emission vehicles make up all new car sales by 2025.
In absolute numbers, China, as the world’s largest consumer market, is leading the charge. In 2021, 3.3 million units were sold in China. To put this number into perspective, this is more than all of the EVs sold globally during 2020.
The Technologies Powering a Switch to EVs
While climate-conscious consumers are increasingly turning to EVs, critical mineral supply and charging infrastructure could be two factors that hold back the phase-out of the internal combustion engine (ICE).
A typical EV uses 207 kg of critical minerals, like graphite and copper, in their construction. In comparison, conventional ICE vehicles use only 33.5 kg.
| Mineral | Conventional Car (kg/vehicle) | Electric Car (kg/vehicle) |
|---|---|---|
| Copper | 22.3 | 53.2 |
| Lithium | 0 | 8.9 |
| Nickel | 0 | 39.9 |
| Manganese | 11.2 | 24.5 |
| Cobalt | 0 | 13.3 |
| Graphite | 0 | 66.3 |
| Zinc | 0 | 0.1 |
| Rare Earth Elements | 0 | 0.5 |
| Other | 0 | 0.3 |
| Total | 33.5 | 207 |
At the same time, all those new vehicles will need power and the public infrastructure to deliver it. The International Energy Agency estimates that to reach net zero by 2050, we will need to build 200 million public charging stations to meet the demand of all those EVs. We will also need to generate an additional 12,400 gigawatts of electricity.
The Wheels on the Bus Go Electric
Passenger vehicles may get the most attention, but public transit and freight transport will also need to move to zero emissions. Heavy and medium freight trucks, and buses, accounted for 2,194 million tons of CO2 in 2021.
China has been investing heavily in the electrification of their bus fleet. Between 2015 and 2021, China was responsible for 694,000 electric bus registrations. On the other hand, Europe and the U.S. were responsible for 9,000 and 6,000 registrations, respectively. In 2021, electric buses made up 4% of the global fleet.
The electric freight market is also being dominated by China, with 103,000 registrations between 2015 and 2021. The U.S. and Europe only recently entered the market, with 1,000 registrations each in 2021. Perhaps reflecting the immaturity of the technology, electric’s share of new truck registrations was less than 0.3% in 2021.
However, the ground appears to be shifting as more and more models come on the market. One estimate for 2023 projects that there will be 243 different electric buses available worldwide, along with 122 medium- and 56 heavy-freight truck models.
Invest in the Future of Road Transport
With the transition to electric vehicles accelerating, there could be more and more opportunities to invest in the future of road transport.
Learn more about the Global X Autonomous & Electric Vehicles ETF (DRIV), which provides exposure to companies involved in the development of autonomous vehicles, EVs, and EV components and materials.
You can also learn how climate change is driving change in road transport in Charting Disruption, a joint report by Global X ETFs and the Wall Street Journal (also available as a downloadable PDF).

-

 Brands1 day ago
How Tech Logos Have Evolved Over Time
From complete overhauls to more subtle tweaks, these tech logos have had quite a journey. Featuring: Google, Apple, and more.
-

 AI2 weeks ago
Ranked: Semiconductor Companies by Industry Revenue Share
Nvidia is coming for Intel’s crown. Samsung is losing ground. AI is transforming the space. We break down revenue for semiconductor companies.
-

 AI2 weeks ago
The Stock Performance of U.S. Chipmakers So Far in 2024
The Nvidia rocket ship is refusing to slow down, leading the pack of strong stock performance for most major U.S. chipmakers.
-

 Technology3 weeks ago
Ranked: The Most Popular Smartphone Brands in the U.S.
This graphic breaks down America’s most preferred smartphone brands, according to a December 2023 consumer survey.
-

 Technology3 weeks ago
Visualizing Nvidia’s Revenue, by Product Line (2019-2024)
This graphic shows how Nvidia’s revenue sources have changed over time, highlighting how the AI boom has transformed its bottom line.
-

 Technology4 weeks ago
Visualizing Internet Usage by Global Region
In this infographic, we map out internet usage by global region based on the latest data from the World Bank.