Sponsored
Inside ESG Ratings: How Companies are Scored
The following content is sponsored by MSCI.

Inside ESG Ratings: How Companies are Scored
Back in 1972, environmental, social, and governance (ESG) investing had a long way to go.
At the time, ESG research was a nascent field, but it paved the way for the booming investment strategy. Now, it is estimated that one in every three investments in the world will be ESG-mandated by 2025—with assets projected to reach $53 trillion.
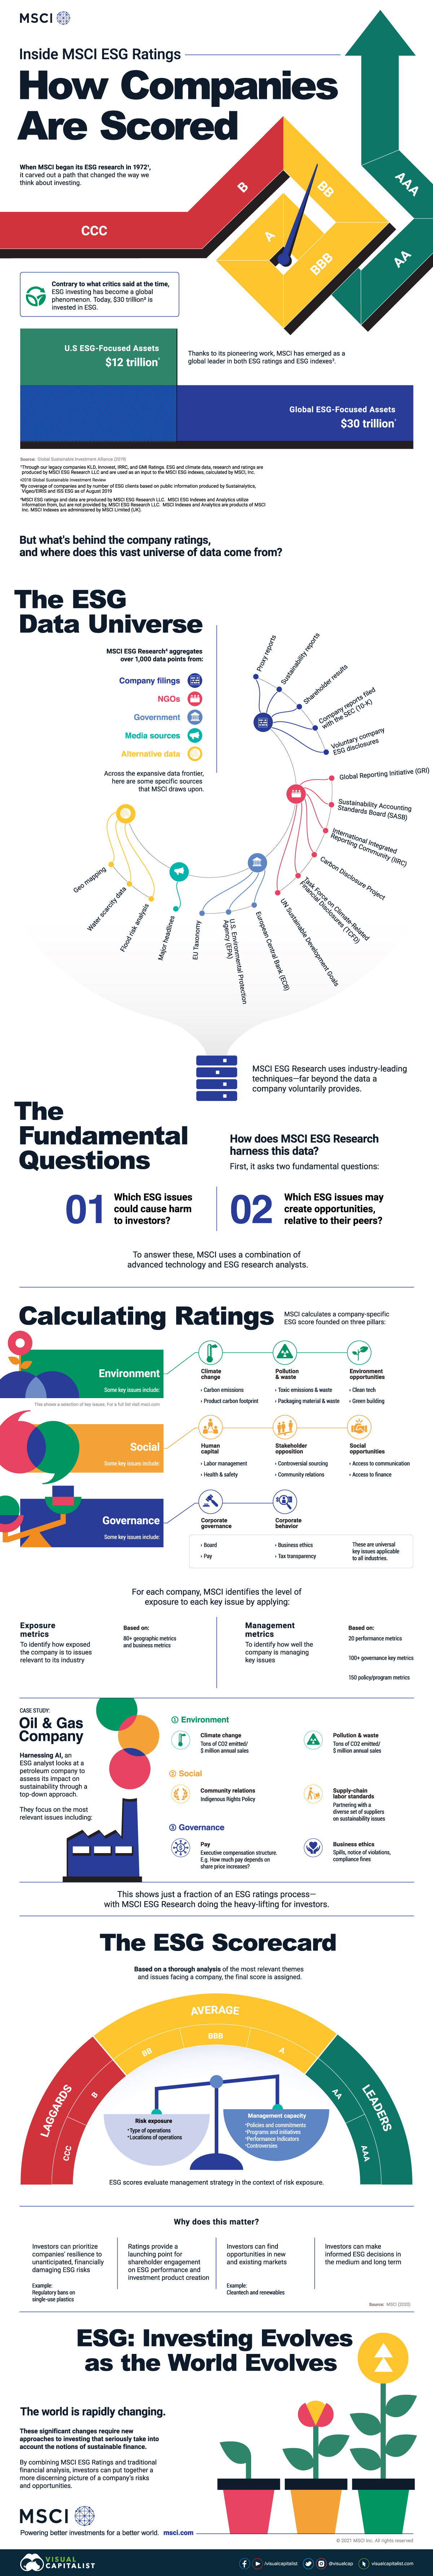
This infographic from MSCI shows what’s behind a company’s ESG rating, and where the expansive universe of data comes from.
The ESG Data Universe
Drawing on over 1,000 data points, MSCI ESG Research collects data from a variety of sources:
- Company filings: Proxy reports, sustainability reports, shareholder results, voluntary company ESG disclosures
- NGOs: Global Reporting Initiative (GRI), Sustainability Accounting Standards Board (SASB), UN Sustainable Development Goals
- Government: U.S. Environmental Protection Agency, European Central Bank, EU Taxonomy
- Media sources: Major headlines
- Alternative data: Geo mapping, water scarcity data, flood risk analysis
Across the expansive data frontier, these are just some of the sources that are drawn on. Typically, a significant amount of data goes beyond what a company will voluntarily provide.
ESG Ratings: The Two Fundamental Questions
During this process, there are two key questions that underlie ESG ratings:
- Which ESG issues could cause harm to investors?
- Which ESG issues may create opportunities, relative to their peers?
To answer these, MSCI uses a combination of technology and ESG analysts.
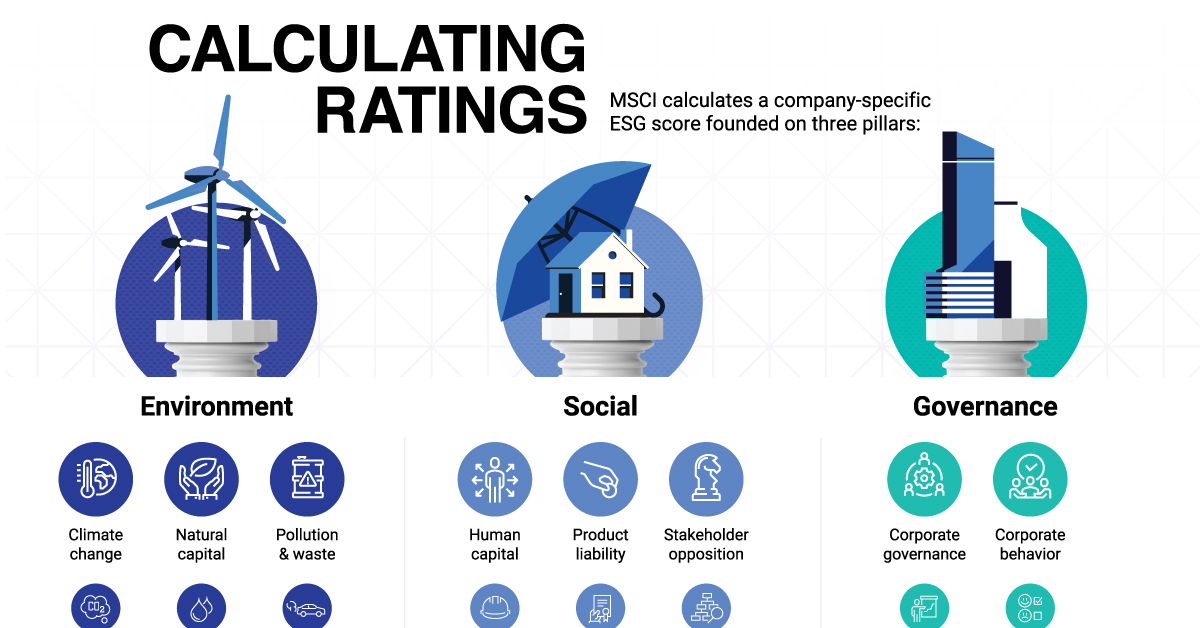
Calculating Ratings
Next, a company-specific score is calculated based on three pillars. Here is a snapshot of some of the key issues that fall within each of the E, S, and G pillars:
Environmental | Social | Governance |
---|---|---|
Climate Change
| Human capital
| Corporate governance
|
Pollution & Waste
| Stakeholder opposition
| Corporate behavior
|
Environment opportunities
| Social opportunities
|
So how does this break down for a specific company?
Case Study: Oil & Gas Company
Harnessing artificial intelligence, an ESG analyst looks at a petroleum company to assess its impact on sustainability through a top-down approach. They focus on the most relevant issues including:
Environmental | Social | Governance |
---|---|---|
Climate change: Tons of CO2 emitted/$ million annual sales | Community relations: Indigenous Rights Policy | Pay: Executive compensation structure |
Pollution & waste: Tons of CO2 emitted/$ million annual sales | Supply-chain labor standards: Partnering with a diverse set of suppliers on sustainability issues | Business ethics: Spills, notice of violations, compliance fines |
Importantly, this shows just a snapshot of the process, while ESG analysts do the heavy-lifting.
The ESG Ratings Scorecard
Finally, based on a thorough analysis of the most relevant themes and issues facing a company, a final score is assigned. Companies are grouped according to three primary tiers:
Laggards | Average | Leaders |
---|---|---|
CCC, B | BB, BBB, A | AA, AAA |
These scores can influence investor decisions on many levels:
- Investors can prioritize a company’s resilience to unanticipated and financially damaging ESG risks.
- Ratings provide a launching point for shareholder engagement on ESG performance and how investment products are created.
- Investors can find opportunities in new and existing markets.
- Investors can make informed ESG decisions in the medium and long term.
Why Do ESG Ratings Matter?
Today, investor demand is one of the chief drivers of ESG investing.
Alongside this, reputational benefits and higher risk-reward tradeoff are playing a larger role in how investors think about sustainability and their investments. But of course, ESG ratings alone are not the entire picture.
By combining ESG ratings and traditional financial analysis, investors can put together a more discerning picture of a company’s risks and opportunities.
Support the Future of Data Storytelling
Sorry to interrupt your reading, but we have a favor to ask. At Visual Capitalist we believe in a world where data can be understood by everyone. That’s why we want to build the VC App - the first app of its kind combining verifiable and transparent data with beautiful, memorable visuals. All available for free.
As a small, independent media company we don’t have the expertise in-house or the funds to build an app like this. So we’re asking our community to help us raise funds on Kickstarter.
If you believe in data-driven storytelling, join the movement and back us on Kickstarter!
Thank you.

Sponsored
ESG Data: The Four Motivations Driving Usage
ESG controversies can damage a company’s value, but ESG data may be able to help manage this risk. What are other reasons for using ESG data?

ESG Data: The Four Motivations Driving Usage
Data is key to the environmental, social, and governance (ESG) revolution. Access to granular ESG data can help boost transparency for market participants. Unfortunately, 63% of U.S. and European asset managers say a lack of quantitative data inhibits their ESG implementation.
Being clear on the potential application of this data is equally important.
- Investors and banks can use ESG data for risk assessment, to spot opportunities, and to push companies for change.
- Companies can publish their own ESG data, quantify progress on their ESG goals, and use data to inform decisions.
- Policymakers can use ESG data to inform regulatory frameworks and measure policy effectiveness.
This graphic from ICE, the second in a three part series on the ESG toolkit, explores four primary motivations of ESG data users.
1. Right Thing
The objective: Having a positive social or environmental impact.
For investors, this can involve screening out companies that conflict with their values and selecting companies that align with their ESG objectives.
As another example, it can involve comparing the social impact of municipal bonds. One way investors can measure social impact is through scores that quantify the potential socioeconomic need of an area, using metrics like poverty and education levels. Here are the social impact scores for three actual municipal bonds issued in Florida.
State | Bond Issuer | Social Impact Score (Higher = larger potential impact) |
---|---|---|
Florida | Issuer #1 | 76.5 |
Florida | Issuer #2 | 66.6 |
Florida | Issuer #3 | 43.2 |
Issuer #1’s bond is projected to have a community impact that is nearly twice as high/positive as Issuer #3’s bond.
For companies, doing the right thing can include assessing their progress on ESG goals and benchmarking themselves to peers. For example, gender and racial representation is a growing area of focus.
2. Risk
The objective: Managing ESG risks, such as climate and reputational risks.
For investors, this can involve back-testing or analysis around specific risk events before they materialize. Here are the risk profiles of two actual municipal bonds in California. The shown bonds are practically identical in many ways, except their wildlife score.
Issuer #1 | Issuer #2 | |
---|---|---|
Current Coupon Rate | 5.0% | 5.0% |
Maturity Date | Aug 01, 2048 | August 01, 2048 |
S&P Rating | AA | AA |
Price to Date (Call Date) | Aug 01, 2027 | Aug 01, 2027 |
Price | 122.0 | 122.0 |
Yield | 1.0% | 1.0% |
Wildfire Score (Higher = more risk) | 3.6 | 2.7 |
Managing ESG risk can also involve analyzing a company’s policies and governance for weaknesses. This is important as an ESG controversy can have long-lasting effects on the valuation of a company.
In one study, companies with ESG controversies dropped more than 10% in value relative to the S&P 500. They hadn’t fully recovered a year after the incident.
3. Revenue
The objective: Targeting outperformance through ESG analysis.
Selecting companies with strong ESG data can align with long-term growth trends and may help boost performance. For heavy emitting industries, research indicates that European companies with lower emissions trade at much higher valuations. The chart below shows companies’ price-to-book ratio relative to the Stoxx 600* sector median.
Utilities | Energy | Materials | |
---|---|---|---|
Above Median Emission Intensity (Bad) | 1.9 | 1.1 | 2.0 |
Below Median Emissions Intensity (Good) | 2.7 | 1.9 | 2.1 |
*The Stoxx 600 Index represents large, mid and small capitalization companies across 17 countries of the European region: Austria, Belgium, Denmark, Finland, France, Germany, Ireland, Italy, Luxembourg, the Netherlands, Norway, Poland, Portugal, Spain, Sweden, Switzerland and the United Kingdom.
Energy companies with low emissions trade at a valuation nearly two times higher than energy companies with high emissions.
4. Regulation
The objective: Understanding and complying with relevant ESG regulation.
The International Sustainability Standards Board has announced a global reporting proposal aligned with the Task Force on Climate-related Financial Disclosures (TCFD). In addition, a growing number of jurisdictions will require organizational reporting that aligns with the TCFD.
- Brazil
- European Union
- Hong Kong
- Japan
- New Zealand
- Singapore
- Switzerland
- UK
Not only that, a European Union regulation known as Sustainable Finance Disclosure Regulation (SFDR) came into effect in 2021. It seeks greater transparency in disclosures from firms marketing investment products. Even firms located outside the EU could be impacted if they serve EU customers. In total, the market cap of these non-EU companies exposed to SFDR amounts to $3.2 trillion.
Matching ESG Data with Motivation
There will be growing demand for transparent data as ESG investing flourishes. To remain competitive, investors, policymakers, and companies need access to ESG data that meets their unique objectives.
In Part 3 of the ESG Toolkit series sponsored by ICE, we’ll look at key sustainability index types.
Sponsored
The Hierarchy of Zero Waste
In a world that generates 2 billion tonnes of waste every year, waste management has become a global concern. Here are some strategies to help guide zero waste policies.

The Hierarchy of Zero Waste
Many cities have set ambitious zero waste targets in the upcoming decades.
The idea is to have communities where waste generation is avoided, and products are shared, reused, or refurbished.
This graphic, sponsored by Northstar Clean Technologies, shows the main strategies and hierarchy to guide zero waste policies.
What is Zero Waste?
In a world that generates approximately 2 billion tons of waste every year, waste management has become a global concern. Thus, countries and cities are increasing efforts to reduce or even eliminate waste when possible.
The Zero Waste International Alliance defines zero waste as “the conservation of all resources by means of responsible production, consumption, reuse, and recovery of products, packaging, and materials without burning and with no discharges to land, water, or air that threaten the environment or human health.”
Becoming a zero waste community, however, is a complex task.
Currently, Sweden recycles 99% of locally-produced waste and is considered the best country in the world when it comes to recycling and reusing waste. However, such results only came after almost 40 years of recycling and reuse policies.
In line with this, here are seven commonly accepted steps you can use to achieve zero waste:
1. Rethink, Redesign Products
The global population consumes 110 billion tons of materials each year, but only 8.6% is reused or recycled. In a zero waste society, single-use products are avoided and products are designed with sustainable practices and materials.
2. Reduce
Consumption must be planned carefully to reduce the unnecessary use of materials. Consumers must choose products that maximize the usable lifespan and opportunities for continuous reuse. Companies must minimize the quantity and toxicity of materials used.
3. Reuse
The value of products is maintained by reusing, repairing, or refurbishing for alternative uses.
4. Recycle
Products are diverted from waste streams and recirculated into use. Resilient local markets are developed, allowing the highest and best use of materials.
5. Material Recovery
Component materials like cement, metals, or asphalt are recovered from mixed waste and collected for other applications.
In the U.S. alone, around 12 million tons of asphalt shingle tear-off waste and installation scrap are generated from roof installation each year. Currently, more than 90% of this is discarded in landfills. This material can be repurposed to create new products like liquid asphalt, fiber, and aggregate.
6. Residuals Management
Waste is biologically stabilized and sent to responsibly managed landfills.
7. Unacceptable
The production of materials that are not recoverable and can negatively impact the environment must be avoided.
Reducing our Climate Impact
Reducing, recycling, and recovering materials can be a key part of a climate change strategy to reduce our greenhouse gas emissions.
According to the U.S. Environmental Protection Agency, about 42% of all greenhouse gas emissions are caused by the production and use of goods, including food, products, and packaging.
Even though 100% zero waste may sound difficult to achieve in the near future, a zero waste approach is essential to reduce our impact on the environment.
Northstar Clean Technologies aims to become the leading recovery and reprocessing company for asphalt shingles in North America.
-
Money3 weeks ago
Mapping the Migration of the World’s Millionaires
-
Markets3 weeks ago
Visualizing the Coming Shift in Global Economic Power (2006-2036p)
-
Energy5 days ago
Who’s Still Buying Fossil Fuels From Russia?
-
Datastream4 weeks ago
Ranked: These Are 10 of the World’s Least Affordable Housing Markets
-
Demographics2 weeks ago
Mapped: A Decade of Population Growth and Decline in U.S. Counties
-
Misc4 weeks ago
Visualizing Well-Known Airlines by Fleet Composition
-
Misc2 weeks ago
Iconic Infographic Map Compares the World’s Mountains and Rivers
-
Markets1 week ago
Interest Rate Hikes vs. Inflation Rate, by Country