Technology
Visualizing the Social Media Universe in 2018
View a high resolution version of this graphic
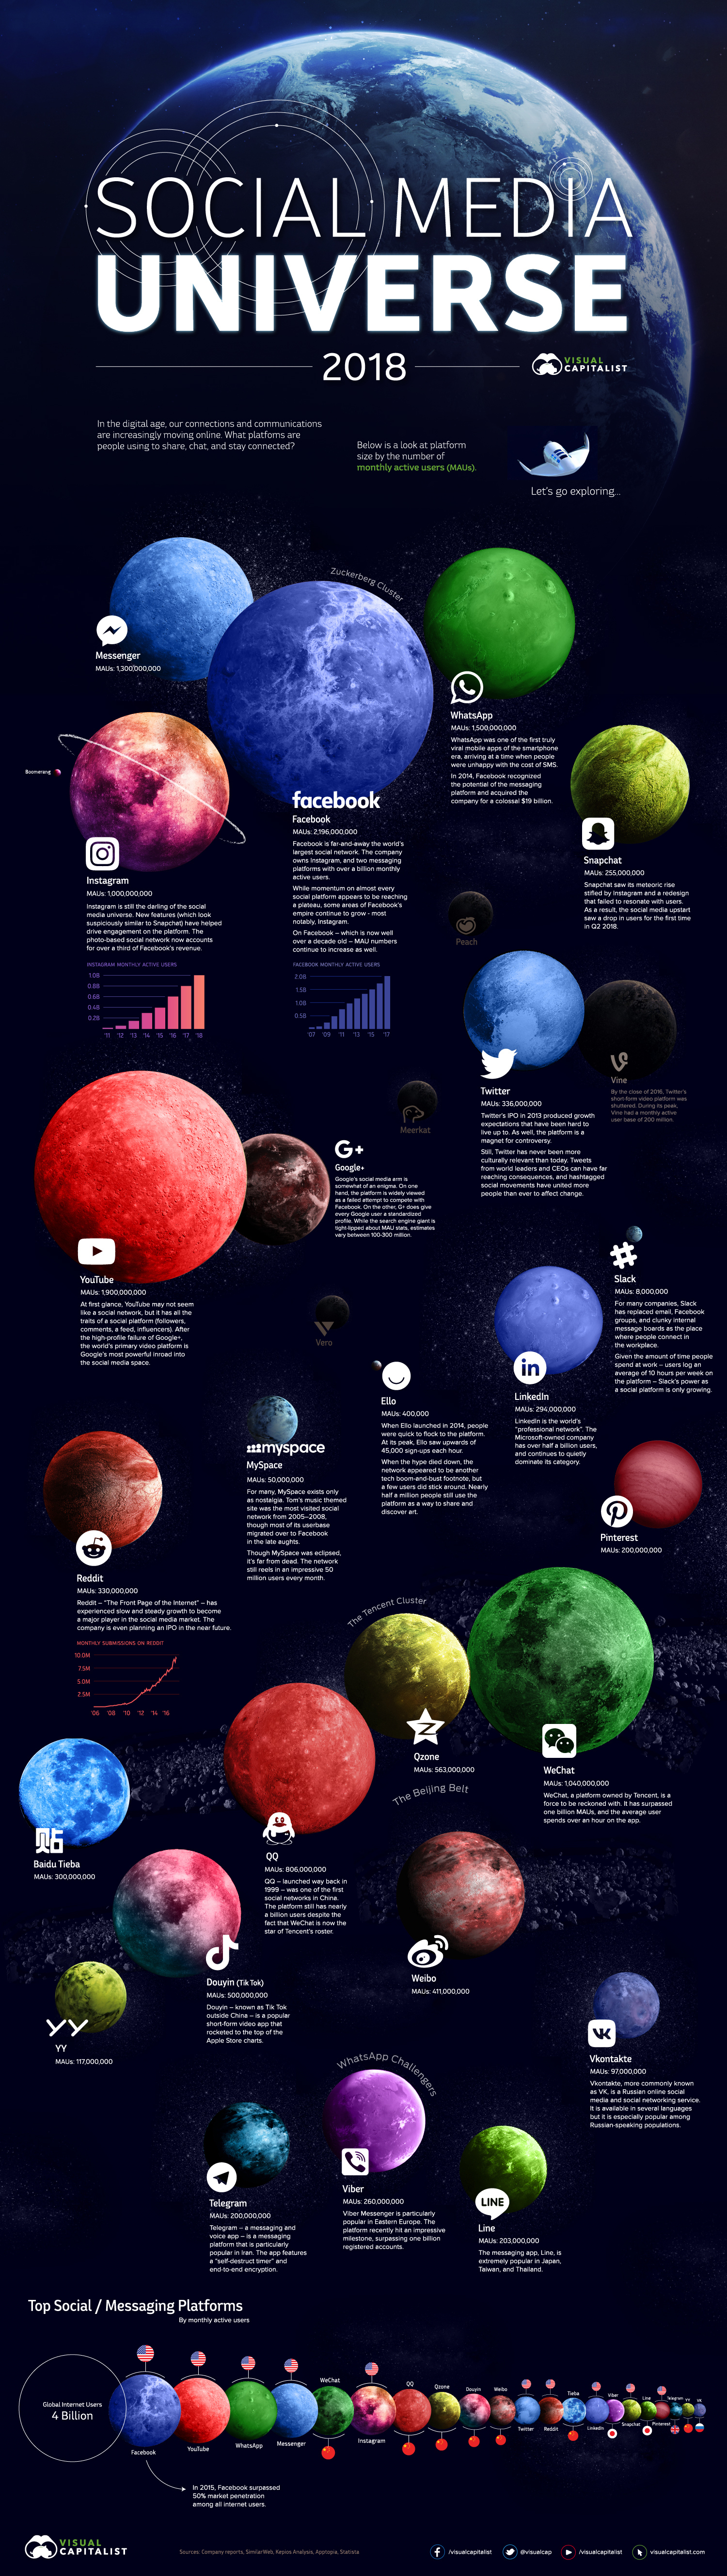
The Social Media Universe: 2018
View the high resolution version of today’s graphic by clicking here.
Billions of people around the world grew up during the age of social media, and mankind is slowly marching toward a future where nearly everyone will be a digital native.
For the one-third of humanity that now uses a smartphone, messaging and status updates are often more natural than having a live conversation. In a world where social interactions are peppered with emojis and funneled through a front-facing camera, the platforms we use become more than mere service providers; they are the connective tissue of our society.
What services are people using to communicate?
Monthly active users (MAUs) is a metric commonly used to evaluate how many people are using a service regularly. Here are the world’s top social and messaging platforms by MAUs:
| Rank | Social Network | Monthly Active Users (MAUs) |
|---|---|---|
| #1 | 2.2 billion | |
| #2 | YouTube | 1.9 billion |
| #3 | 1.5 billion | |
| #4 | Messenger | 1.3 billion |
| #5 | 1.0 billion | |
| #6 | 1.0 billion | |
| #7 | 806 million | |
| #8 | Qzone | 563 million |
| #9 | Douyin | 500 million |
| #10 | 411 million | |
| #11 | 366 million | |
| #12 | 330 million | |
| #13 | Baidu Tieba | 300 million |
| #14 | 294 million | |
| #15 | Viber | 260 million |
| #16 | Snapchat | 255 million |
| #17 | Line | 203 million |
| #18 | Telegram | 200 million |
| #19 | 200 million | |
| #20 | YY | 117 million |
| #21 | VK | 97 million |
Let’s take a closer look at these massive platforms.
The Facebook Empire
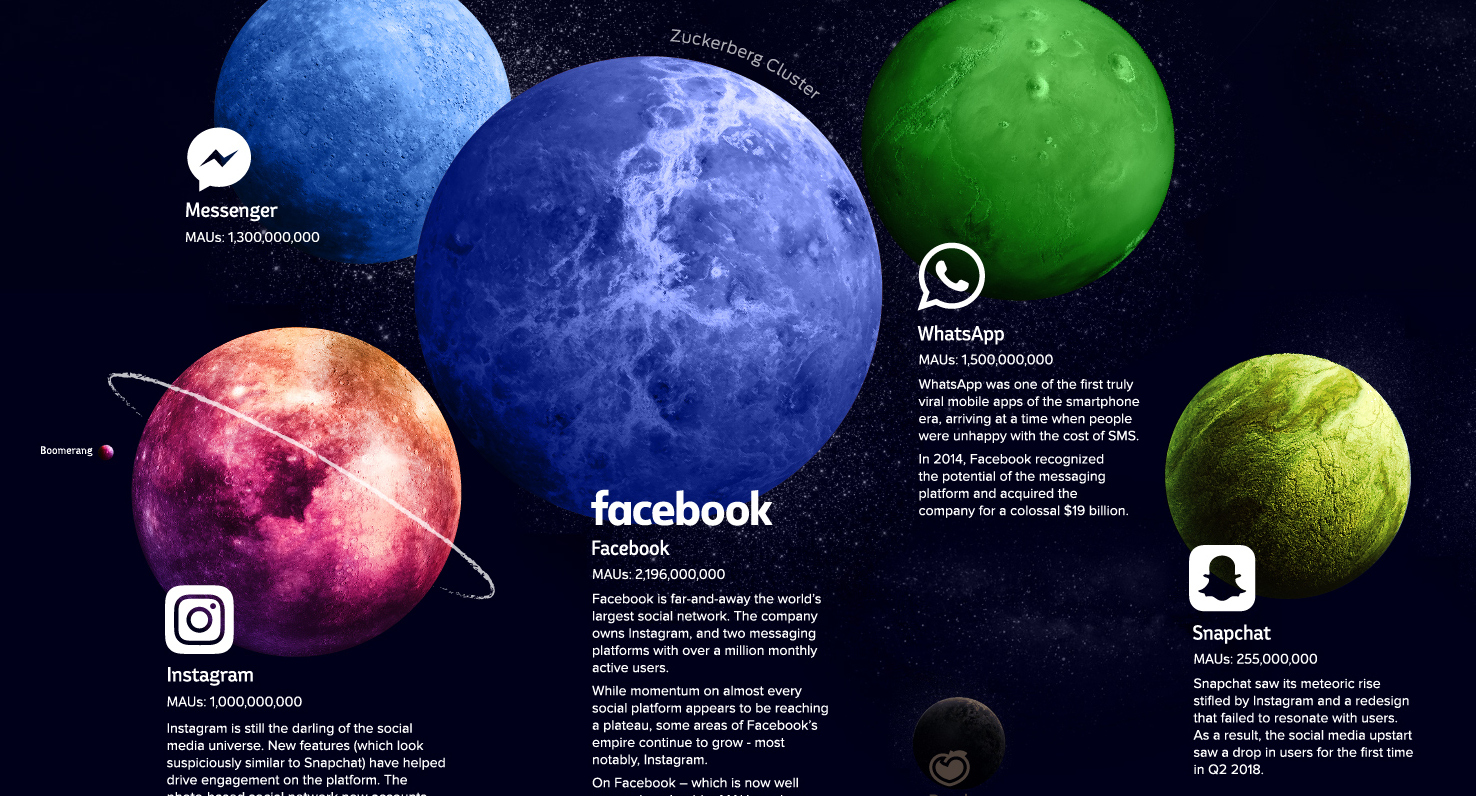
On its own, Facebook is a behemoth, but adding in the other platforms run by Mark Zuckerberg paints a clear picture of who controls the social media in 2018.
During its growth spurt in the late aughts, Facebook emerged as the first truly global social networks, hitting one billion monthly active users and essentially popularizing the idea of social media. These days, Facebook appears to be hitting engagement and growth plateaus, but acquisitions such as Instagram and WhatsApp are fueling growth for the company, with the former accounting for over a third of revenue.
In China, WeChat isn’t just a typical messenger app.
This “super app” – which facilitates everything from point-of-sale purchases to accessing public services – is likely the template that other social platforms around the world will emulate as they strive for more thorough integration with their users’ lives.
Because WeChat is typically also used for work, the average user spends about an hour in-app each day. That is a level of engagement most platforms can only dream of.
The “Front Page of the Internet” has grown up.
The oft controversial message board – created in 2005 – is now worth an estimated $1.8 billion, and is contemplating an IPO in the near future. While the company does make money from advertising, a unique membership feature called Reddit Gold is helping bring in funding directly from the community.
When people have something to say publicly or look to debate big issues in the news cycle, more often than not, they use Twitter. Tweets from world leaders and CEOs can have far-reaching consequences, and hashtagged social movements have united more people than ever to affect change. For better or worse, Twitter fills an important role in modern society.
Unfortunately for Twitter, great responsibility has translated into greater scrutiny rather than strong revenue growth. The company has faced high profile controversies over harassment, bots, and fake news, and has struggled to match the sky-high growth expectations set when the “microblogging” platform went public in 2013. Twitter is still experimenting with new ways to monetize its 300+ million active user base.
SnapChat
In 2015, Snapchat, having already thoroughly conquered the under-18 market, looked set to disrupt the social media landscape. What came next was a tragedy in two acts.
First, Instagram released its Story feature that same year, effectively cloning Snapchat’s features and layout within their app. Many users, who had only recently began using novel new platform, flocked back to Instagram where they already had a developed following.
Secondly, a redesign of the Snapchat interface was widely criticized by high profile users, speeding up an exodus to Instagram.
Snapchat, which has since gone public, still has a quarter of billion MAUs, but questions remain about whether the platform can recapture the magic of their earlier years.


Technology
Ranked: Semiconductor Companies by Industry Revenue Share
Nvidia is coming for Intel’s crown. Samsung is losing ground. AI is transforming the space. We break down revenue for semiconductor companies.


Semiconductor Companies by Industry Revenue Share
This was originally posted on our Voronoi app. Download the app for free on Apple or Android and discover incredible data-driven charts from a variety of trusted sources.
Did you know that some computer chips are now retailing for the price of a new BMW?
As computers invade nearly every sphere of life, so too have the chips that power them, raising the revenues of the businesses dedicated to designing them.
But how did various chipmakers measure against each other last year?
We rank the biggest semiconductor companies by their percentage share of the industry’s revenues in 2023, using data from Omdia research.
Which Chip Company Made the Most Money in 2023?
Market leader and industry-defining veteran Intel still holds the crown for the most revenue in the sector, crossing $50 billion in 2023, or 10% of the broader industry’s topline.
All is not well at Intel, however, with the company’s stock price down over 20% year-to-date after it revealed billion-dollar losses in its foundry business.
| Rank | Company | 2023 Revenue | % of Industry Revenue |
|---|---|---|---|
| 1 | Intel | $51B | 9.4% |
| 2 | NVIDIA | $49B | 9.0% |
| 3 | Samsung Electronics | $44B | 8.1% |
| 4 | Qualcomm | $31B | 5.7% |
| 5 | Broadcom | $28B | 5.2% |
| 6 | SK Hynix | $24B | 4.4% |
| 7 | AMD | $22B | 4.1% |
| 8 | Apple | $19B | 3.4% |
| 9 | Infineon Tech | $17B | 3.2% |
| 10 | STMicroelectronics | $17B | 3.2% |
| 11 | Texas Instruments | $17B | 3.1% |
| 12 | Micron Technology | $16B | 2.9% |
| 13 | MediaTek | $14B | 2.6% |
| 14 | NXP | $13B | 2.4% |
| 15 | Analog Devices | $12B | 2.2% |
| 16 | Renesas Electronics Corporation | $11B | 1.9% |
| 17 | Sony Semiconductor Solutions Corporation | $10B | 1.9% |
| 18 | Microchip Technology | $8B | 1.5% |
| 19 | Onsemi | $8B | 1.4% |
| 20 | KIOXIA Corporation | $7B | 1.3% |
| N/A | Others | $126B | 23.2% |
| N/A | Total | $545B | 100% |
Note: Figures are rounded. Totals and percentages may not sum to 100.
Meanwhile, Nvidia is very close to overtaking Intel, after declaring $49 billion of topline revenue for 2023. This is more than double its 2022 revenue ($21 billion), increasing its share of industry revenues to 9%.
Nvidia’s meteoric rise has gotten a huge thumbs-up from investors. It became a trillion dollar stock last year, and broke the single-day gain record for market capitalization this year.
Other chipmakers haven’t been as successful. Out of the top 20 semiconductor companies by revenue, 12 did not match their 2022 revenues, including big names like Intel, Samsung, and AMD.
The Many Different Types of Chipmakers
All of these companies may belong to the same industry, but they don’t focus on the same niche.
According to Investopedia, there are four major types of chips, depending on their functionality: microprocessors, memory chips, standard chips, and complex systems on a chip.
Nvidia’s core business was once GPUs for computers (graphics processing units), but in recent years this has drastically shifted towards microprocessors for analytics and AI.
These specialized chips seem to be where the majority of growth is occurring within the sector. For example, companies that are largely in the memory segment—Samsung, SK Hynix, and Micron Technology—saw peak revenues in the mid-2010s.

-

 Green2 weeks ago
Ranked: Top Countries by Total Forest Loss Since 2001
-

 Travel1 week ago
Ranked: The World’s Top Flight Routes, by Revenue
-

 Technology1 week ago
Ranked: Semiconductor Companies by Industry Revenue Share
-

 Money2 weeks ago
Which States Have the Highest Minimum Wage in America?
-

 Real Estate2 weeks ago
Ranked: The Most Valuable Housing Markets in America
-

 Markets2 weeks ago
Charted: Big Four Market Share by S&P 500 Audits
-

 AI2 weeks ago
The Stock Performance of U.S. Chipmakers So Far in 2024
-

 Automotive2 weeks ago
Almost Every EV Stock is Down After Q1 2024