Misc
The Side Hustle Economy: 25 Ways to Make Extra Dough
Popularized in recent years by people like Gary Vaynerchuk, the “side hustle” has quickly become a preferred mentality for aspiring entrepreneurs to make additional money on the side.
The gist of it is: by working hard outside the traditional hours of a 9-to-5, a side hustle allows you to build a business around what you are truly passionate about. And if that endeavor is successful, it can also help you make the full transition into permanent entrepreneurship later on.
Enter the Side Hustle Economy
Today’s practical infographic from Quid Corner highlights 25 different ways to dip your toes into the side hustle economy.
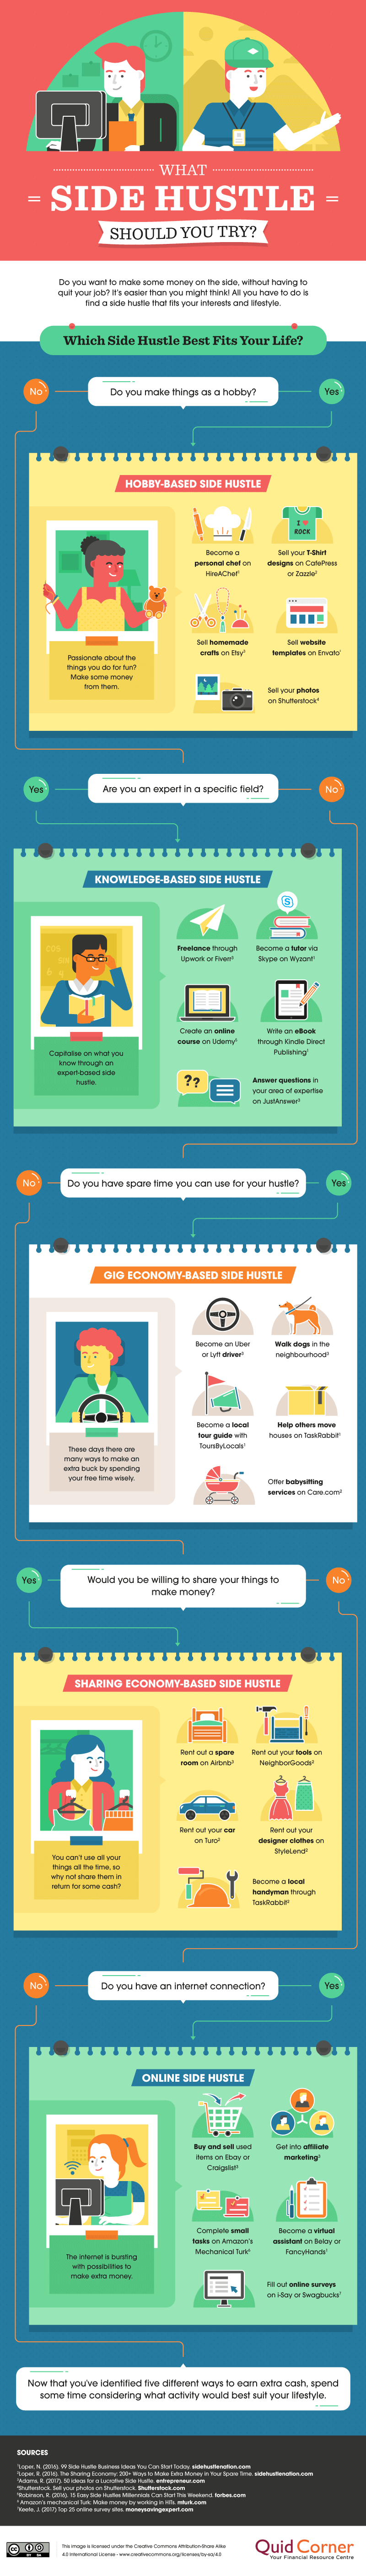
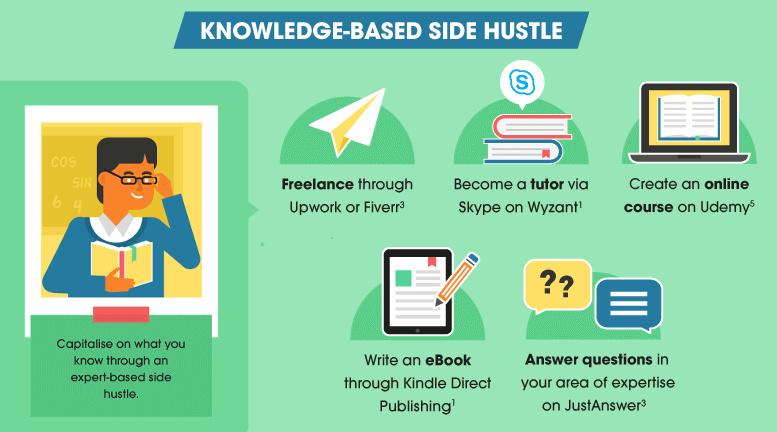
Some of these side hustles, like building courses or writing eBooks on your area of expertise, are great ways to begin building your personal thought leadership brand.
Meanwhile, other hustles listed here are more appropriate for supplementing your regular income. Getting extra cash in your pocket – and on your own terms – can help give you the confidence to start a business, or invest in further education.
Going From 0 to 60
If you are ready to make the dive into entrepreneurship, we previously posted 5 Ideas for Online Businesses in 2017.
If you’re still just getting your feet wet, it’s side hustle time. Work on the side for additional capital, get a proof-of-concept for your idea, or find ways to build your personal brand.
Even if your ambitions are huge, start slow, start small, build gradually, build smart.
– Gary Vaynerchuk, Serial Entrepreneur
Side hustling allows you to get a start while still having two feet on the ground. However, that’s not to say that side hustling is easy – it takes lot of work and commitment, and you have to be prepared to spend evenings and weekends to pursue your passion, with no guarantee for immediate results.
Here’s a few other infographic resources to help you get started or motivated:
- Why Businesses Fail
- The Habits of Highly Successful Entrepreneurs
- 31 Quotes on How to Launch a Startup
- 20 Reasons Why Startups Fail
- What Can We Learn From the Desks of Elon Musk and Mark Zuckerberg?
Good luck out there.


Misc
How Hard Is It to Get Into an Ivy League School?
We detail the admission rates and average annual cost for Ivy League schools, as well as the median SAT scores required to be accepted.


How Hard Is It to Get Into an Ivy League School?
This was originally posted on our Voronoi app. Download the app for free on iOS or Android and discover incredible data-driven charts from a variety of trusted sources.
Ivy League institutions are renowned worldwide for their academic excellence and long-standing traditions. But how hard is it to get into one of the top universities in the U.S.?
In this graphic, we detail the admission rates and average annual cost for Ivy League schools, as well as the median SAT scores required to be accepted. The data comes from the National Center for Education Statistics and was compiled by 24/7 Wall St.
Note that “average annual cost” represents the net price a student pays after subtracting the average value of grants and/or scholarships received.
Harvard is the Most Selective
The SAT is a standardized test commonly used for college admissions in the United States. It’s taken by high school juniors and seniors to assess their readiness for college-level academic work.
When comparing SAT scores, Harvard and Dartmouth are among the most challenging universities to gain admission to. The median SAT scores for their students are 760 for reading and writing and 790 for math. Still, Harvard has half the admission rate (3.2%) compared to Dartmouth (6.4%).
| School | Admission rate (%) | SAT Score: Reading & Writing | SAT Score: Math | Avg Annual Cost* |
|---|---|---|---|---|
| Harvard University | 3.2 | 760 | 790 | $13,259 |
| Columbia University | 3.9 | 750 | 780 | $12,836 |
| Yale University | 4.6 | 760 | 780 | $16,341 |
| Brown University | 5.1 | 760 | 780 | $26,308 |
| Princeton University | 5.7 | 760 | 780 | $11,080 |
| Dartmouth College | 6.4 | 760 | 790 | $33,023 |
| University of Pennsylvania | 6.5 | 750 | 790 | $14,851 |
| Cornell University | 7.5 | 750 | 780 | $29,011 |
*Costs after receiving federal financial aid.
Additionally, Dartmouth has the highest average annual cost at $33,000. Princeton has the lowest at $11,100.
While student debt has surged in the United States in recent years, hitting $1.73 trillion in 2023, the worth of obtaining a degree from any of the schools listed surpasses mere academics. This is evidenced by the substantial incomes earned by former students.
Harvard grads, for example, have the highest average starting salary in the country, at $91,700.

-

 Green2 weeks ago
Ranked: Top Countries by Total Forest Loss Since 2001
-

 Travel1 week ago
Ranked: The World’s Top Flight Routes, by Revenue
-

 Technology2 weeks ago
Ranked: Semiconductor Companies by Industry Revenue Share
-

 Money2 weeks ago
Which States Have the Highest Minimum Wage in America?
-

 Real Estate2 weeks ago
Ranked: The Most Valuable Housing Markets in America
-

 Markets2 weeks ago
Charted: Big Four Market Share by S&P 500 Audits
-

 AI2 weeks ago
The Stock Performance of U.S. Chipmakers So Far in 2024
-

 Automotive2 weeks ago
Almost Every EV Stock is Down After Q1 2024