Markets
Visualizing the Coming Shift in Global Economic Power (2006-2036p)
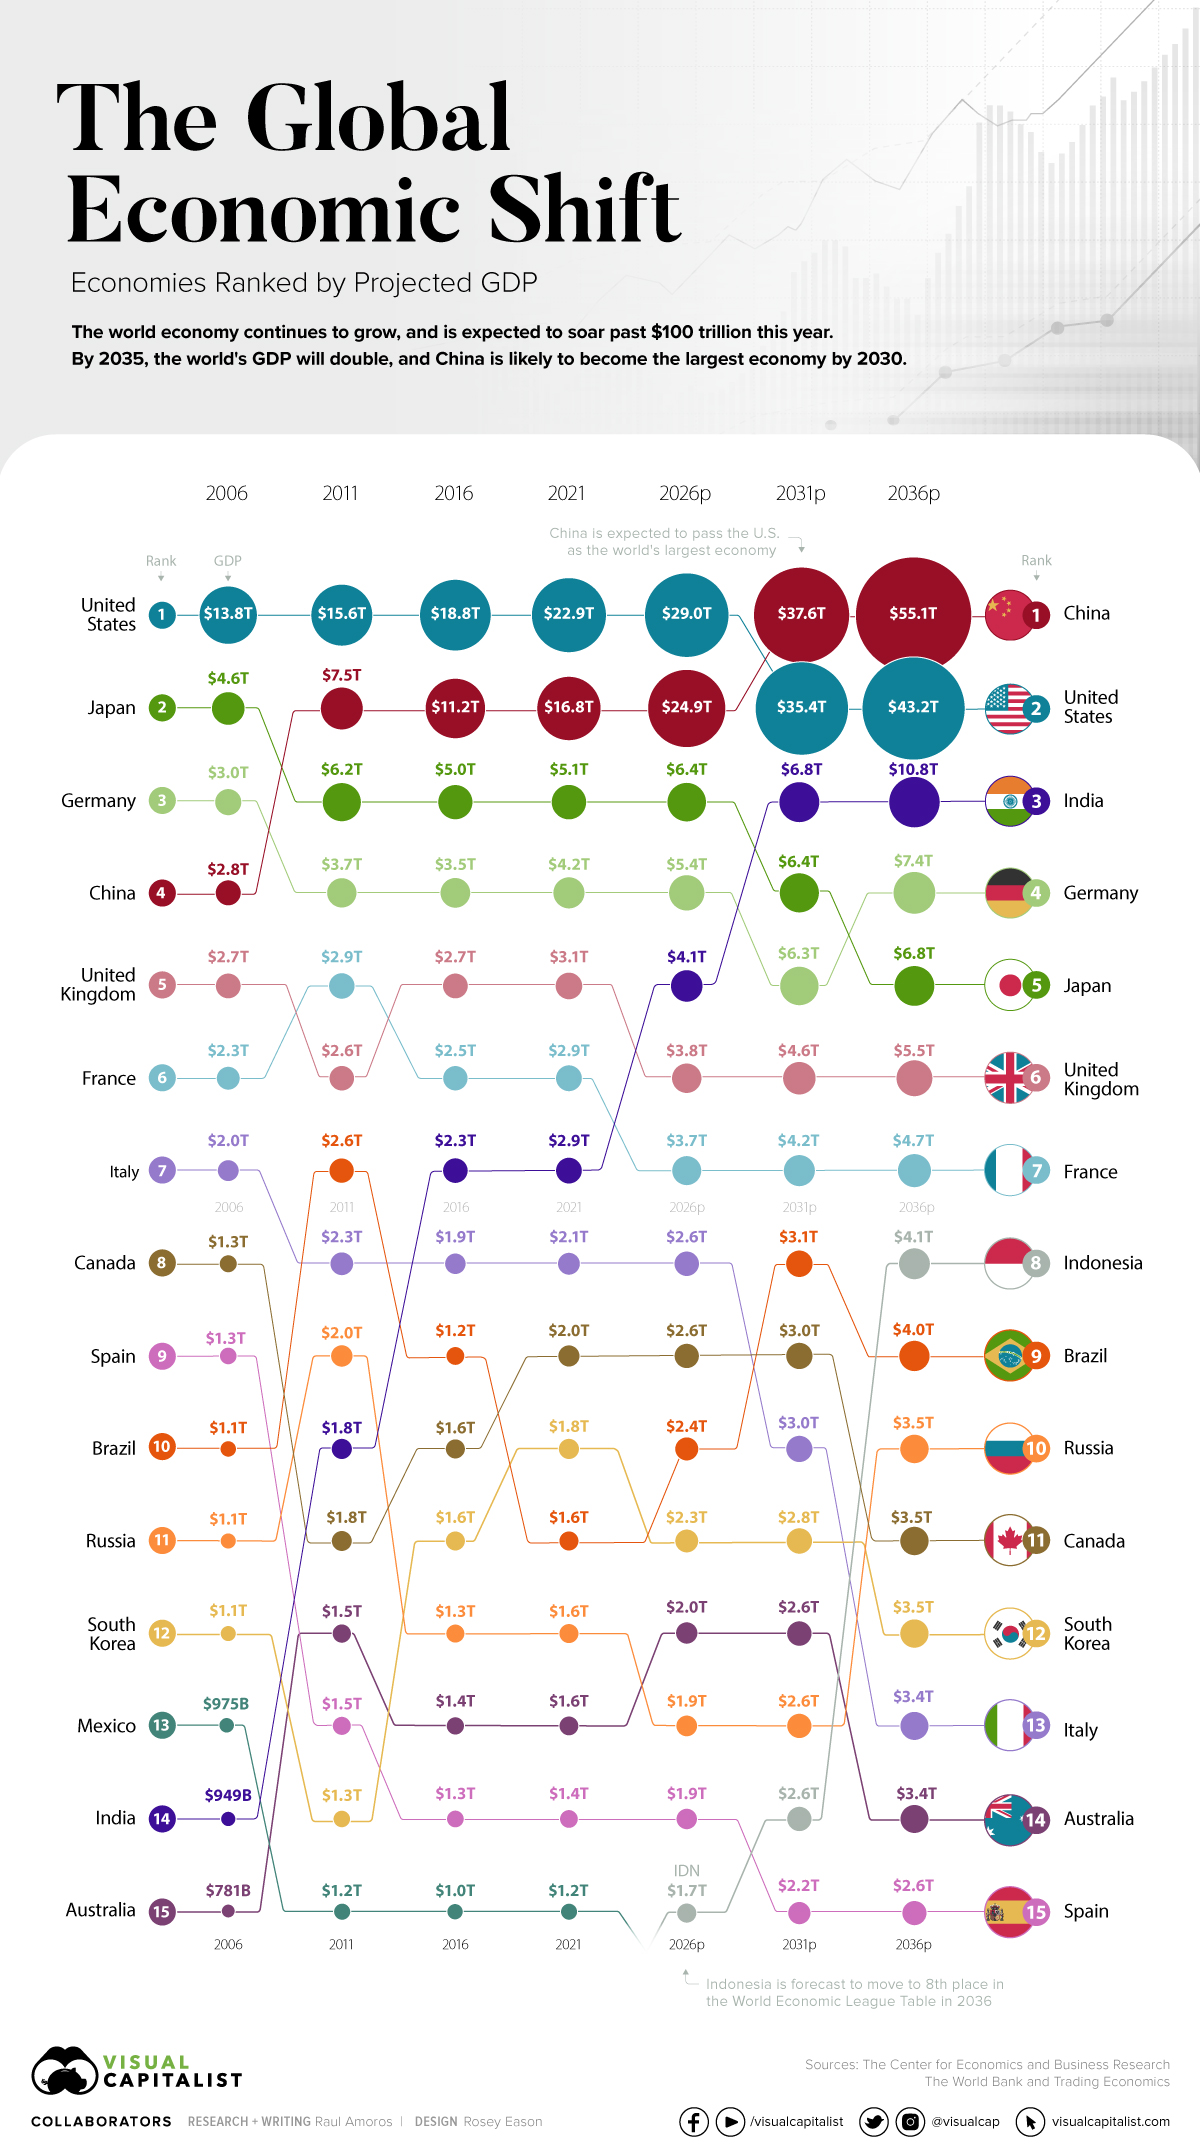


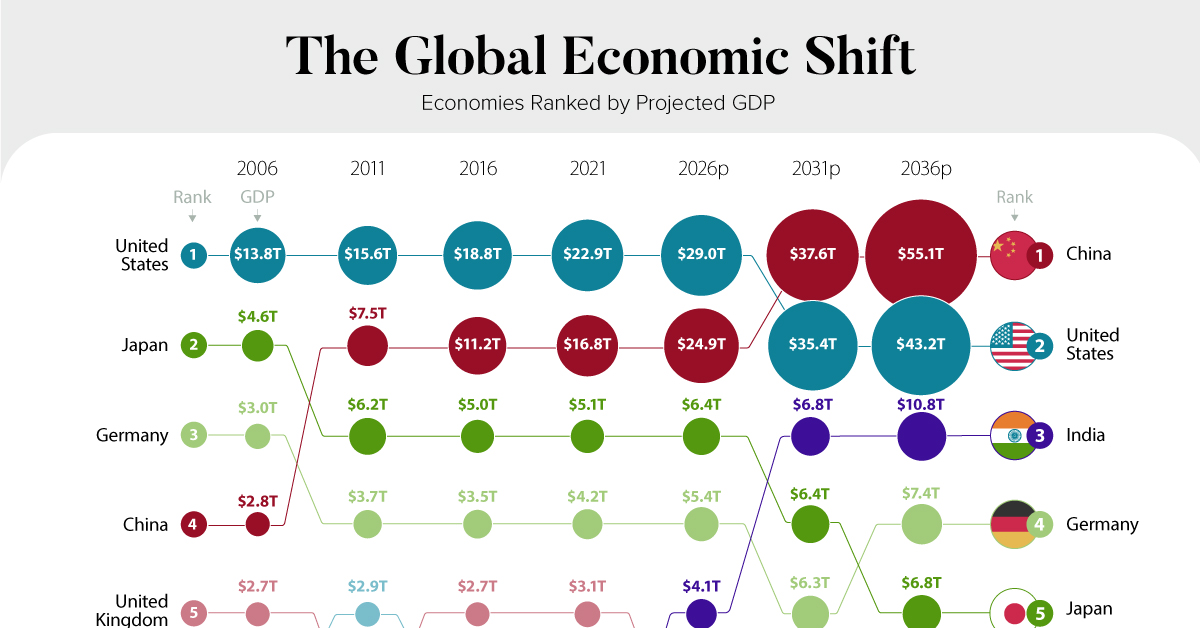
Visualizing the Shift in Global Economic Power
As the post-pandemic recovery chugs along, the global economy is set to see major changes in the coming decades. Most significantly, China is forecast to pass the United States to become the largest economy globally.
The world’s economic center has long been drifting from Europe and North America over to Asia. This global shift was kickstarted by lowered trade barriers and greater economic freedom, which attracted foreign direct investment (FDI). Another major driving factor was the improvements in infrastructure and communications, and a general increase in economic complexity in the region.
Our visualization uses data from the 13th edition of World Economic League Table 2022, a forecast published by the Center for Economics and Business Research (CEBR).
When Will China Become the Largest Economic Power?
China is expected to surpass the U.S. by the year 2030. A faster than expected recovery in the U.S. in 2021, and China’s struggles under the “Zero-COVID” policies have delayed the country taking the top spot by about two years.
China has maintained its positive GDP growth due to the stability provided by domestic demand. This has proven crucial in sustaining the country’s economic growth. China’s fiscal and economic policy had focused on this prior to the pandemic over fears of growing Western trade restrictions.
India is Primed for the #3 Spot
India is expected to become the third largest country in terms of GDP with $10.8 trillion projected in 2031.
Looking back, India had a GDP of just $949 billion in 2006. Fast forward to today and India’s GDP has more than tripled, reaching $3.1 trillion in 2022. Over the next 15 years, it’s expected to triple yet again. What is behind this impressive growth?
For starters, the country’s economy had a lot more room to improve than other nations. Demographics are also working in the country’s favor. While the median age in many mature economies is shooting up, India has a youthful workforce. In fact, India’s median age is a full 20 years lower than Japan, which is currently the third largest economy.
Over the last 60 years, the service industry has boomed to around 55% of India’s GDP. Telecommunications, software, and IT generate most of the revenue in this sector. IT alone produces 10% of the country’s GDP. India’s large tech-savvy, English-speaking workforce has proved attractive for international companies like Intel, Google, Meta, Microsoft, IBM, and many others, while the domestic startup scene continues to boom.
The Indian government is also pursuing “production-linked incentives” (i.e. subsidies) for multinational companies looking to diversify their production away from China. If these incentives prove successful, more of the world’s solar panels and smartphones will be produced within India’s borders.
How Will the Global Economy Look in 2031?
By the year 2031, there will be major changes in the global economic power rankings.
As we said before: China will have become the world’s largest economy in terms of GDP and India will be the world’s third largest economy. Let’s also take a look at the top 10 economies by 2031.
| Rank | Country | Region | Projected GDP in 2031 (in Trillions of USD) |
|---|---|---|---|
| 1 | 🇨🇳 China | Asia | $37.6 |
| 2 | 🇺🇸 United States | North America | $35.4 |
| 3 | 🇮🇳 India | Asia | $6.8 |
| 4 | 🇯🇵 Japan | Asia | $6.4 |
| 5 | 🇩🇪 Germany | Europe | $6.3 |
| 6 | 🇬🇧 United Kingdom | Europe | $4.6 |
| 7 | 🇫🇷 France | Europe | $4.2 |
| 8 | 🇧🇷 Brazil | South America | $3.1 |
| 9 | 🇨🇦 Canada | North America | $3.0 |
| 10 | 🇮🇹 Italy | Europe | $3.0 |
Out of the top five economies, three are located in Asia: China, India, and Japan—a clear demonstration of how economic power is shifting towards large population centers in Asia.
Europe will have four countries in the top 10: Germany, the United Kingdom, France, and Italy. From South America, only Brazil appears in the top 10.
Under these projections, Russia sits outside the top 10 in 2031. Of course, it remains to be seen how crushing sanctions and global isolation will affect the economic trajectory of the country.
Now, the big question. Is it inevitable that China takes the top spot in the global economy as predicted by this forecast? The truth is that nothing is guaranteed. Other projections have modeled reasonable alternative scenarios for China’s economy. A debt crisis, international isolation, or a shrinking population could keep China’s economy in second place for longer than expected.


Markets
U.S. Debt Interest Payments Reach $1 Trillion
U.S. debt interest payments have surged past the $1 trillion dollar mark, amid high interest rates and an ever-expanding debt burden.


U.S. Debt Interest Payments Reach $1 Trillion
This was originally posted on our Voronoi app. Download the app for free on iOS or Android and discover incredible data-driven charts from a variety of trusted sources.
The cost of paying for America’s national debt crossed the $1 trillion dollar mark in 2023, driven by high interest rates and a record $34 trillion mountain of debt.
Over the last decade, U.S. debt interest payments have more than doubled amid vast government spending during the pandemic crisis. As debt payments continue to soar, the Congressional Budget Office (CBO) reported that debt servicing costs surpassed defense spending for the first time ever this year.
This graphic shows the sharp rise in U.S. debt payments, based on data from the Federal Reserve.
A $1 Trillion Interest Bill, and Growing
Below, we show how U.S. debt interest payments have risen at a faster pace than at another time in modern history:
| Date | Interest Payments | U.S. National Debt |
|---|---|---|
| 2023 | $1.0T | $34.0T |
| 2022 | $830B | $31.4T |
| 2021 | $612B | $29.6T |
| 2020 | $518B | $27.7T |
| 2019 | $564B | $23.2T |
| 2018 | $571B | $22.0T |
| 2017 | $493B | $20.5T |
| 2016 | $460B | $20.0T |
| 2015 | $435B | $18.9T |
| 2014 | $442B | $18.1T |
| 2013 | $425B | $17.2T |
| 2012 | $417B | $16.4T |
| 2011 | $433B | $15.2T |
| 2010 | $400B | $14.0T |
| 2009 | $354B | $12.3T |
| 2008 | $380B | $10.7T |
| 2007 | $414B | $9.2T |
| 2006 | $387B | $8.7T |
| 2005 | $355B | $8.2T |
| 2004 | $318B | $7.6T |
| 2003 | $294B | $7.0T |
| 2002 | $298B | $6.4T |
| 2001 | $318B | $5.9T |
| 2000 | $353B | $5.7T |
| 1999 | $353B | $5.8T |
| 1998 | $360B | $5.6T |
| 1997 | $368B | $5.5T |
| 1996 | $362B | $5.3T |
| 1995 | $357B | $5.0T |
| 1994 | $334B | $4.8T |
| 1993 | $311B | $4.5T |
| 1992 | $306B | $4.2T |
| 1991 | $308B | $3.8T |
| 1990 | $298B | $3.4T |
| 1989 | $275B | $3.0T |
| 1988 | $254B | $2.7T |
| 1987 | $240B | $2.4T |
| 1986 | $225B | $2.2T |
| 1985 | $219B | $1.9T |
| 1984 | $205B | $1.7T |
| 1983 | $176B | $1.4T |
| 1982 | $157B | $1.2T |
| 1981 | $142B | $1.0T |
| 1980 | $113B | $930.2B |
| 1979 | $96B | $845.1B |
| 1978 | $84B | $789.2B |
| 1977 | $69B | $718.9B |
| 1976 | $61B | $653.5B |
| 1975 | $55B | $576.6B |
| 1974 | $50B | $492.7B |
| 1973 | $45B | $469.1B |
| 1972 | $39B | $448.5B |
| 1971 | $36B | $424.1B |
| 1970 | $35B | $389.2B |
| 1969 | $30B | $368.2B |
| 1968 | $25B | $358.0B |
| 1967 | $23B | $344.7B |
| 1966 | $21B | $329.3B |
Interest payments represent seasonally adjusted annual rate at the end of Q4.
At current rates, the U.S. national debt is growing by a remarkable $1 trillion about every 100 days, equal to roughly $3.6 trillion per year.
As the national debt has ballooned, debt payments even exceeded Medicaid outlays in 2023—one of the government’s largest expenditures. On average, the U.S. spent more than $2 billion per day on interest costs last year. Going further, the U.S. government is projected to spend a historic $12.4 trillion on interest payments over the next decade, averaging about $37,100 per American.
Exacerbating matters is that the U.S. is running a steep deficit, which stood at $1.1 trillion for the first six months of fiscal 2024. This has accelerated due to the 43% increase in debt servicing costs along with a $31 billion dollar increase in defense spending from a year earlier. Additionally, a $30 billion increase in funding for the Federal Deposit Insurance Corporation in light of the regional banking crisis last year was a major contributor to the deficit increase.
Overall, the CBO forecasts that roughly 75% of the federal deficit’s increase will be due to interest costs by 2034.

-

 Money2 weeks ago
Which States Have the Highest Minimum Wage in America?
-

 Misc1 week ago
Airline Incidents: How Do Boeing and Airbus Compare?
-

 Environment1 week ago
Top Countries By Forest Growth Since 2001
-

 Economy2 weeks ago
Where U.S. Inflation Hit the Hardest in March 2024
-

 Demographics2 weeks ago
The Smallest Gender Wage Gaps in OECD Countries
-

 Markets2 weeks ago
The Top 10 States by Real GDP Growth in 2023
-

 Demographics2 weeks ago
Population Projections: The World’s 6 Largest Countries in 2075
-

 Travel2 weeks ago
Ranked: The World’s Top Flight Routes, by Revenue