Economic Growth Forecasts for G7 and BRICS Countries in 2024
U.S. Debt Interest Payments Reach $1 Trillion
Ranked: The Largest U.S. Corporations by Number of Employees
The Top 10 States by Real GDP Growth in 2023
Ranked: The World’s Top Flight Routes, by Revenue
Visualizing AI Patents by Country
How Tech Logos Have Evolved Over Time
Ranked: Semiconductor Companies by Industry Revenue Share
The Stock Performance of U.S. Chipmakers So Far in 2024
Ranked: The Most Popular Smartphone Brands in the U.S.
Charted: Who Has Savings in This Economy?
How Debt-to-GDP Ratios Have Changed Since 2000
The Smallest Gender Wage Gaps in OECD Countries
Which States Have the Highest Minimum Wage in America?
Where Does One U.S. Tax Dollar Go?
The Cost of an EpiPen in Major Markets
Charted: Global Tobacco Use by Country and Sex
Visualized: What Lives in Your Gut Microbiome?
Charted: Average Years Left to Live by Age
Charted: The Average Cost of Insulin By Country
Ranked: The Top 10 EV Battery Manufacturers in 2023
The World’s Biggest Nuclear Energy Producers
The World’s Biggest Oil Producers in 2023
How Much Does the U.S. Depend on Russian Uranium?
Charted: Global Uranium Reserves, by Country
The Largest Earthquakes in the New York Area (1970-2024)
Mapped: Average Wages Across Europe
Mapped: Asia’s Population Patterns by Density
A Map of Global Happiness By Country in 2024
Mapped: Population Growth by Region (1900-2050F)
Gold vs. S&P 500: Which Has Grown More Over Five Years?
Charted: The Value Gap Between the Gold Price and Gold Miners
The Periodic Table of Commodity Returns (2014-2023)
Ranking the Top 15 Countries by Carbon Tax Revenue
Ranked: The Countries With the Most Air Pollution in 2023
Top Countries By Forest Growth Since 2001
Ranked: Top Countries by Total Forest Loss Since 2001
The World’s Top Cocoa Producing Countries
...reduce China’s share of its total rare earth imports to less than 50% by 2025. Increasing rare earth mining outside of China has reduced China’s global...
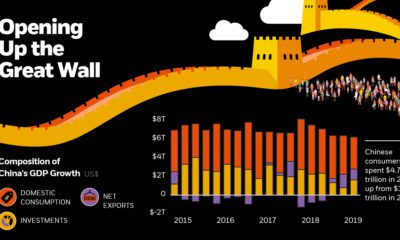
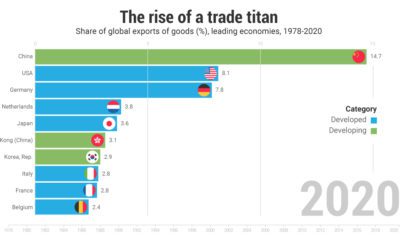
...stages of building its economy. The above animated chart from the UNCTAD showcases China’s rise to global trade dominance over time. Timeline: The Rise to Power...
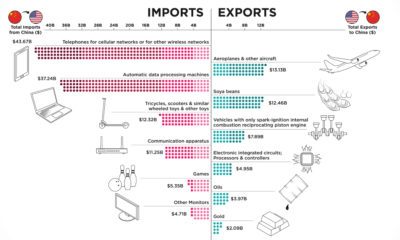
...60% of the market. But how has the recent trade war impacted the imports and exports between the U.S. and China? The U.S.-China Trade War Continues...
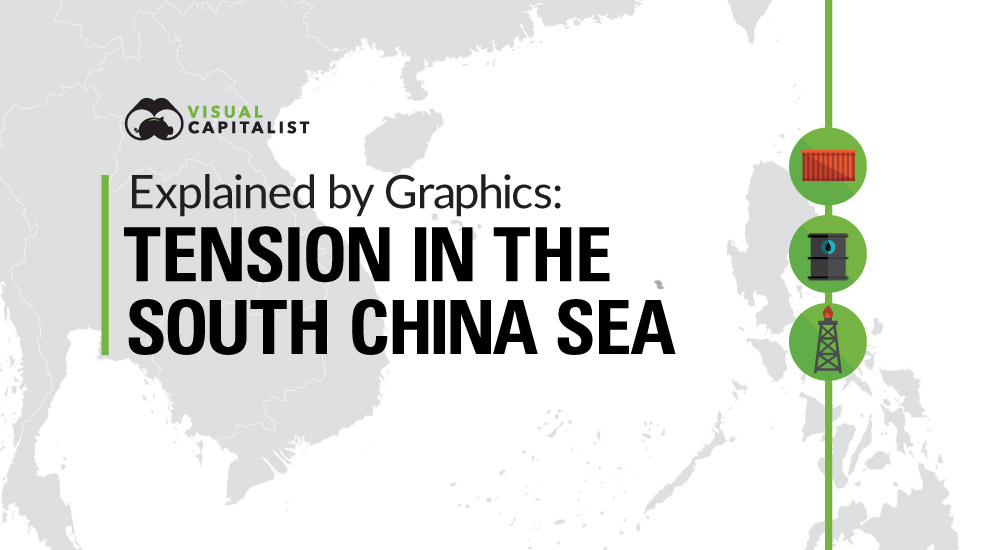
Explained by Graphics: Tension in the South China Sea Claims on the South China Sea, the recent ruling, and why China is ignoring it The Chart...
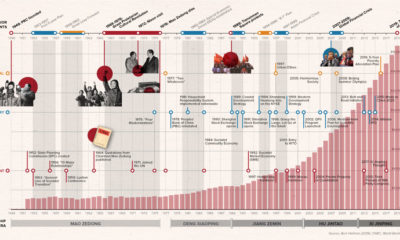
Chart: 70 Years of China’s Economic Growth View a high-resolution version of this graphic here. From agrarian economy to global superpower in half a century—China’s transformation...
Visualizing China’s $18 Trillion Economy in 2021 China is the world’s second largest economy after the U.S., and it is expected to eventually climb into the...
...Communication Corp. (China Satcom) China China Satellite Communication Corp. (China Satcom) China China Satellite Communication Corp. (China Satcom) China China Satellite Communication Corp. (China Satcom) China...
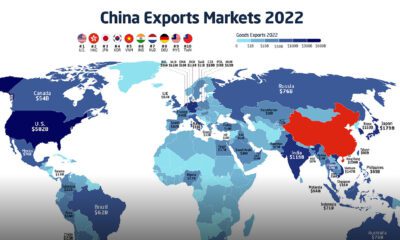
...China to track the biggest destinations of China’s merchandise exports—defined as goods that leave the territory of a country—since the 2000s. China’s Top Export Markets from...
...Chemicals / Fertilizer $174B 🇨🇳 China Railway Engineering Group Holding Company $172B 🇨🇳 China National Offshore Oil Oil and Gas $165B 🇨🇳 China Railway Construction Construction...
...foreign capital on a global scale. China’s moves are funding the nation’s next stage of growth, and are also creating new investment opportunities for foreign investors....


 Creator Program