Politics
The Science of Nuclear Weapons, Visualized
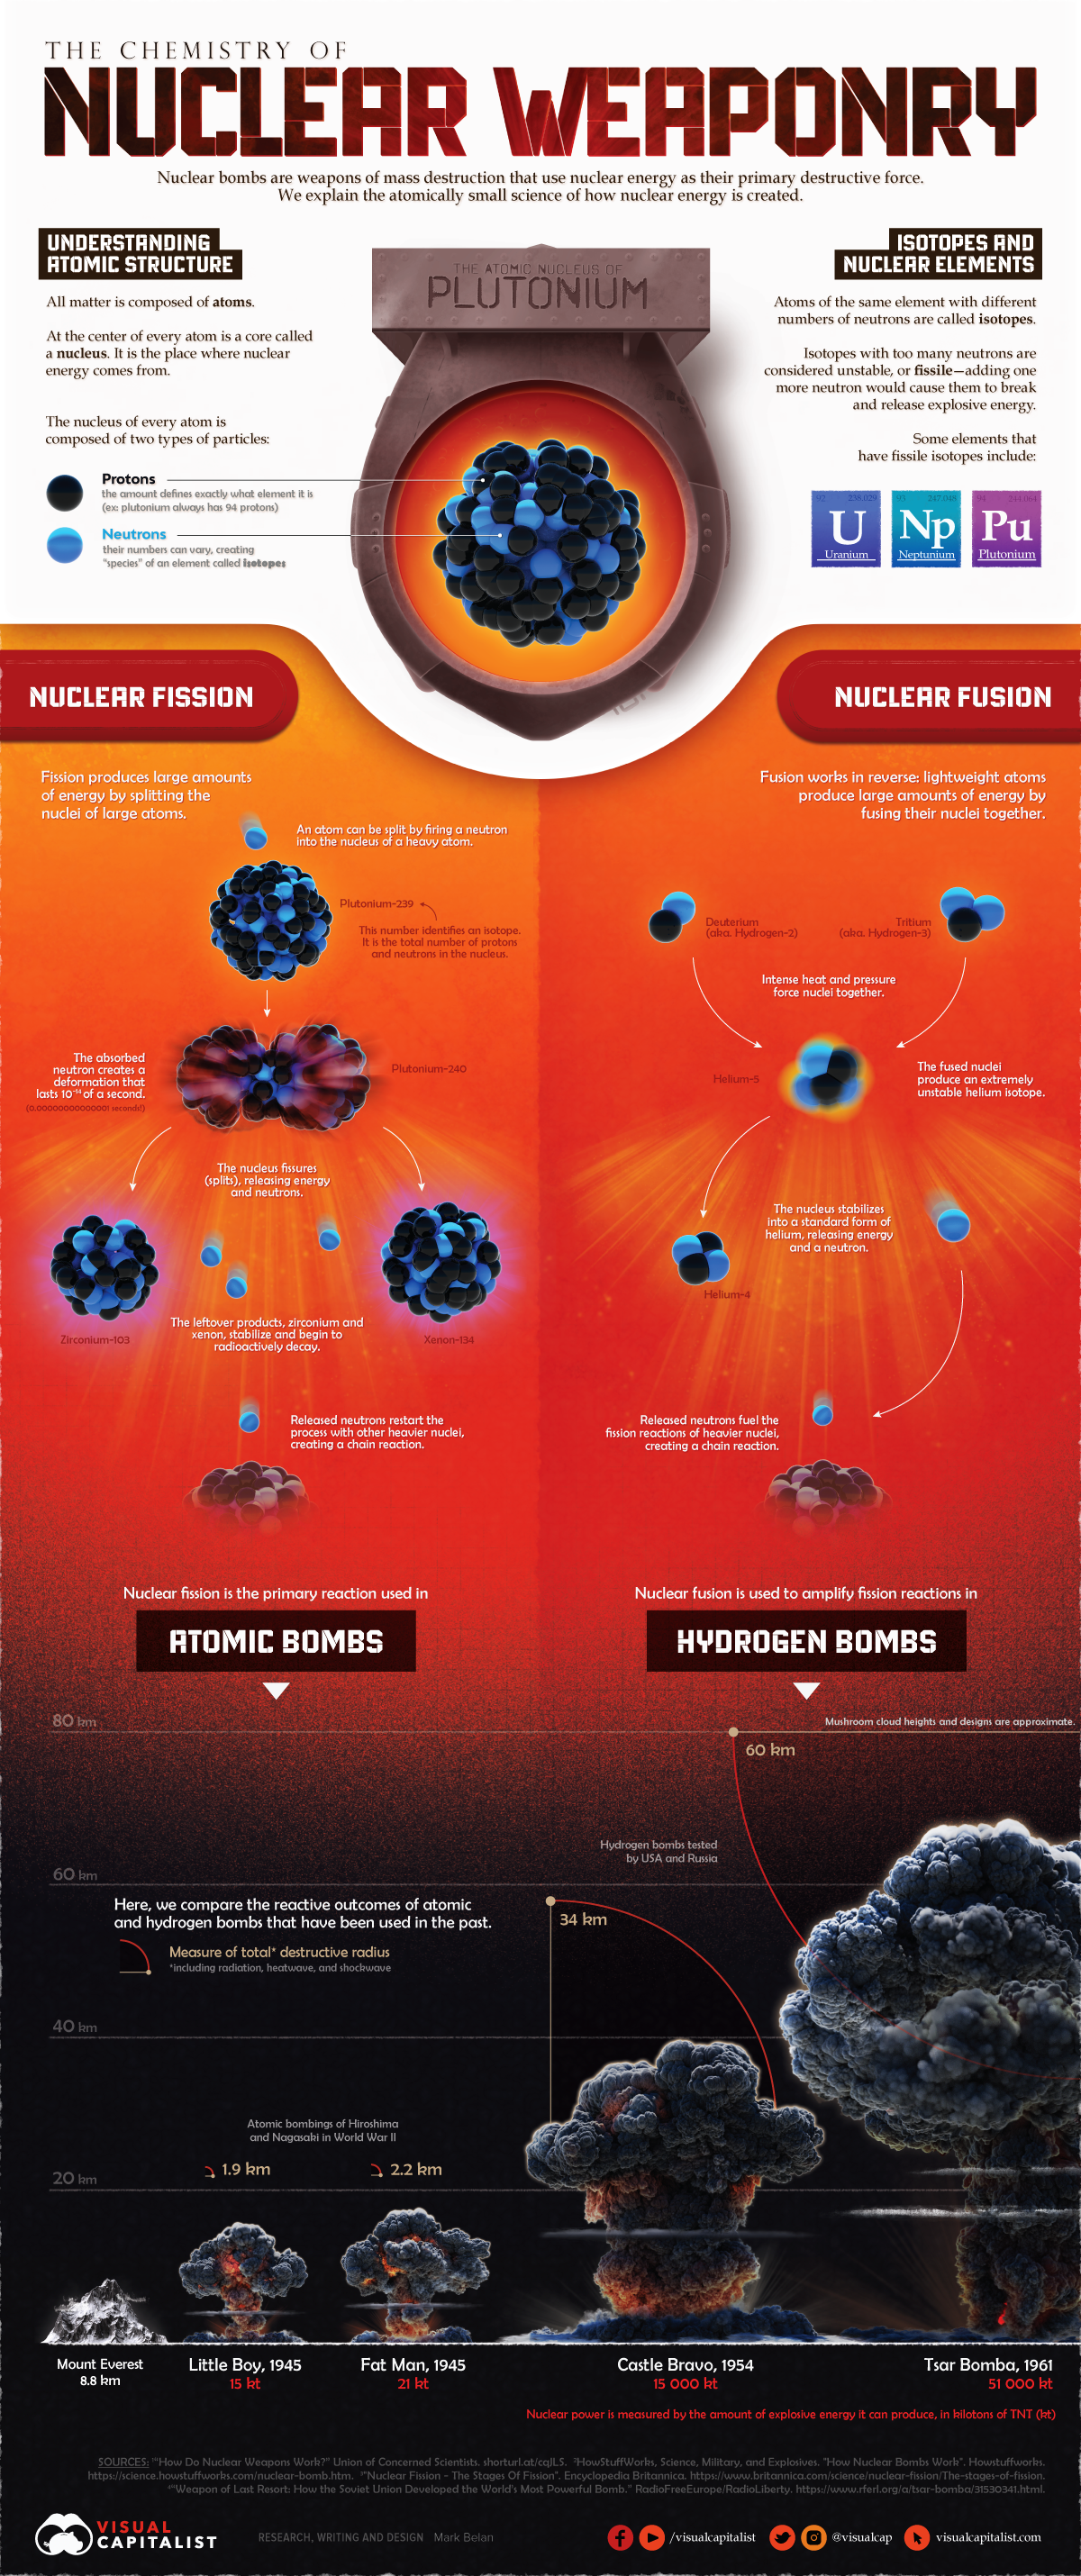


Visualized: How Nuclear Weapons Work
In 1945, the world’s first-ever nuclear weapon was detonated at the Trinity test site in New Mexico, United States, marking the beginning of the Atomic Age.
Since then, the global nuclear stockpile has multiplied, and when geopolitical tensions rise, the idea of a nuclear apocalypse understandably causes widespread concern.
But despite their catastrophically large effects, the science of how nuclear weapons work is atomically small.
The Atomic Science of Nuclear Weapons
All matter is composed of atoms, which host different combinations of three particles—protons, electrons, and neutrons. Nuclear weapons work by capitalizing on the interactions of protons and neutrons to create an explosive chain reaction.
At the center of every atom is a core called the nucleus, which is composed of closely-bound protons and neutrons. While the number of protons is unique to each element in the periodic table, the number of neutrons can vary. As a result, there are multiple “species” of some elements, known as isotopes.
For example, here are some isotopes of uranium:
- Uranium-238: 92 protons, 146 neutrons
- Uranium-235: 92 protons, 143 neutrons
- Uranium-234: 92 protons, 142 neutrons
These isotopes can be stable or unstable. Stable isotopes have a relatively static or unchanging number of neutrons. But when a chemical element has too many neutrons, it becomes unstable or fissile.
When fissile isotopes attempt to become stable, they shed excess neutrons and energy. This energy is where nuclear weapons get their explosivity from.
There are two types of nuclear weapons:
- Atomic Bombs: These rely on a domino effect of multiple fission reactions to produce an explosion, using either uranium or plutonium.
- Hydrogen Bombs: These rely on a combination of fission and fusion using uranium or plutonium, with the help of lighter elements like the isotopes of hydrogen.
So, what exactly is the difference between fission and fusion reactions?
Splitting Atoms: Nuclear Fission
Nuclear fission—the process used by nuclear reactors—produces large amounts of energy by breaking apart a heavier unstable atom into two smaller atoms, starting a nuclear chain reaction.
When a neutron is fired into the nucleus of a fissile atom like uranium-235, the uranium atom splits into two smaller atoms known as “fissile fragments” in addition to more neutrons and energy. These excess neutrons can then start a self-sustaining chain reaction by hitting the nuclei of other uranium-235 atoms, resulting in an atomic explosion.
Atomic bombs use nuclear fission, though it’s important to note that a fission chain reaction requires a particular amount of a fissile material like uranium-235, known as the supercritical mass.
Merging Atoms: Nuclear Fusion
Hydrogen bombs use a combination of fission and fusion, with nuclear fusion amplifying a fission reaction to produce a much more powerful explosion than atomic bombs.
Fusion is essentially the opposite of fission—instead of splitting a heavier atom into smaller atoms, it works by putting together two atoms to form a third unstable atom. It’s also the same process that fuels the Sun.
Nuclear fusion mainly relies on isotopes of lighter elements, like the two isotopes of hydrogen—deuterium and tritium. When subjected to intense heat and pressure, these two atoms fuse together to form an extremely unstable helium isotope, which releases energy and neutrons.
The released neutrons then fuel the fission reactions of heavier atoms like uranium-235, creating an explosive chain reaction.
How Atomic and Hydrogen Bombs Compare
Just how powerful are hydrogen bombs, and how do they compare to atomic bombs?
| Bomb | Type | Energy produced (kilotons of TNT) |
|---|---|---|
| Little Boy 🇺🇸 | Atomic | 15kt |
| Fat Man 🇺🇸 | Atomic | 21kt |
| Castle Bravo 🇺🇸 | Hydrogen | 15,000kt |
| Tsar Bomba 🇷🇺 | Hydrogen | 51,000kt |
The bombs Little Boy and Fat Man were used in the atomic bombings of Hiroshima and Nagasaki in 1945, bringing a destructive end to World War II. The scale of these bombings was, at the time, unparalleled. But comparing these to hydrogen bombs shows just how powerful nuclear weapons have become.
Castle Bravo was the codename for the United States’ largest-ever nuclear weapon test, a hydrogen bomb that produced a yield of 15,000 kilotons—making it 1,000 times more powerful than Little Boy. What’s more, radioactive traces from the explosion, which took place on the Marshall Islands near Fiji, were found in Australia, India, Japan, U.S., and Europe.
Seven years later, the Soviet Union tested Tsar Bomba in 1961, the world’s most powerful nuclear weapon. The explosion produced 51,000 kilotons of explosive energy, with a destructive radius of roughly 60km.
Given how damaging a single nuke can be, it’s difficult to imagine the outcome of an actual nuclear conflict without fear of total annihilation, especially with the world’s nuclear arsenal sitting at over 13,000 warheads.


Economy
The Bloc Effect: International Trade with Geopolitical Allies on the Rise
Rising geopolitical tensions are shaping the future of international trade, but what is the effect on trading among G7 and BRICS countries?


The Bloc Effect: International Trade with Allies on the Rise
International trade has become increasingly fragmented over the last five years as countries have shifted to trading more with their geopolitical allies.
This graphic from The Hinrich Foundation, the first in a three-part series covering the future of trade, provides visual context to the growing divide in trade in G7 and pre-expansion BRICS countries, which are used as proxies for geopolitical blocs.
Trade Shifts in G7 and BRICS Countries
This analysis uses IMF data to examine differences in shares of exports within and between trading blocs from 2018 to 2023. For example, we looked at the percentage of China’s exports with other BRICS members as well as with G7 members to see how these proportions shifted in percentage points (pp) over time.
Countries traded nearly $270 billion more with allies in 2023 compared to 2018. This shift came at the expense of trade with rival blocs, which saw a decline of $314 billion.
Country Change in Exports Within Bloc (pp) Change in Exports With Other Bloc (pp)
🇮🇳 India 0.0 3.9
🇷🇺 Russia 0.7 -3.8
🇮🇹 Italy 0.8 -0.7
🇨🇦 Canada 0.9 -0.7
🇫🇷 France 1.0 -1.1
🇪🇺 EU 1.1 -1.5
🇩🇪 Germany 1.4 -2.1
🇿🇦 South Africa 1.5 1.5
🇺🇸 U.S. 1.6 -0.4
🇯🇵 Japan 2.0 -1.7
🇨🇳 China 2.1 -5.2
🇧🇷 Brazil 3.7 -3.3
🇬🇧 UK 10.2 0.5
All shifts reported are in percentage points. For example, the EU saw its share of exports to G7 countries rise from 74.3% in 2018 to 75.4% in 2023, which equates to a 1.1 percentage point increase.
The UK saw the largest uptick in trading with other countries within the G7 (+10.2 percentage points), namely the EU, as the post-Brexit trade slump to the region recovered.
Meanwhile, the U.S.-China trade dispute caused China’s share of exports to the G7 to fall by 5.2 percentage points from 2018 to 2023, the largest decline in our sample set. In fact, partly as a result of the conflict, the U.S. has by far the highest number of harmful tariffs in place.
The Russia-Ukraine War and ensuing sanctions by the West contributed to Russia’s share of exports to the G7 falling by 3.8 percentage points over the same timeframe.
India, South Africa, and the UK bucked the trend and continued to witness advances in exports with the opposing bloc.
Average Trade Shifts of G7 and BRICS Blocs
Though results varied significantly on a country-by-country basis, the broader trend towards favoring geopolitical allies in international trade is clear.
Bloc Change in Exports Within Bloc (pp) Change in Exports With Other Bloc (pp)
Average 2.1 -1.1
BRICS 1.6 -1.4
G7 incl. EU 2.4 -1.0
Overall, BRICS countries saw a larger shift away from exports with the other bloc, while for G7 countries the shift within their own bloc was more pronounced. This implies that though BRICS countries are trading less with the G7, they are relying more on trade partners outside their bloc to make up for the lost G7 share.
A Global Shift in International Trade and Geopolitical Proximity
The movement towards strengthening trade relations based on geopolitical proximity is a global trend.
The United Nations categorizes countries along a scale of geopolitical proximity based on UN voting records.
According to the organization’s analysis, international trade between geopolitically close countries rose from the first quarter of 2022 (when Russia first invaded Ukraine) to the third quarter of 2023 by over 6%. Conversely, trade with geopolitically distant countries declined.
The second piece in this series will explore China’s gradual move away from using the U.S. dollar in trade settlements.
Visit the Hinrich Foundation to learn more about the future of geopolitical trade

-

 Economy11 hours ago
Economic Growth Forecasts for G7 and BRICS Countries in 2024
The IMF has released its economic growth forecasts for 2024. How do the G7 and BRICS countries compare?
-

 United States1 week ago
Ranked: The Largest U.S. Corporations by Number of Employees
We visualized the top U.S. companies by employees, revealing the massive scale of retailers like Walmart, Target, and Home Depot.
-

 Economy2 weeks ago
Where U.S. Inflation Hit the Hardest in March 2024
We visualized product categories that saw the highest % increase in price due to U.S. inflation as of March 2024.
-

 Economy4 weeks ago
G20 Inflation Rates: Feb 2024 vs COVID Peak
We visualize inflation rates across G20 countries as of Feb 2024, in the context of their COVID-19 pandemic peak.
-

 Jobs1 month ago
Mapped: Unemployment Claims by State
This visual heatmap of unemployment claims by state highlights New York, California, and Alaska leading the country by a wide margin.
-

 Markets2 months ago
Confidence in the Global Economy, by Country
Will the global economy be stronger in 2024 than in 2023?


-

 Markets1 week ago
U.S. Debt Interest Payments Reach $1 Trillion
-

 Markets2 weeks ago
Ranked: The Most Valuable Housing Markets in America
-

 Money2 weeks ago
Which States Have the Highest Minimum Wage in America?
-

 AI2 weeks ago
Ranked: Semiconductor Companies by Industry Revenue Share
-

 Markets2 weeks ago
Ranked: The World’s Top Flight Routes, by Revenue
-

 Countries2 weeks ago
Population Projections: The World’s 6 Largest Countries in 2075
-

 Markets2 weeks ago
The Top 10 States by Real GDP Growth in 2023
-

 Money2 weeks ago
The Smallest Gender Wage Gaps in OECD Countries