Markets
Satellite Maps: Shanghai’s Supply Chain Standstill
Satellite Maps: Shanghai’s Supply Chain Standstill
China has mandated a strict “zero COVID” policy since the onset of the global pandemic, which has led to tight lockdowns across the country whenever cases have started to spike.
Recently, lockdown restrictions have been enacted in major cities like Shenzhen and Shanghai, as China deals with one of its worst outbreaks since Wuhan in December 2019.
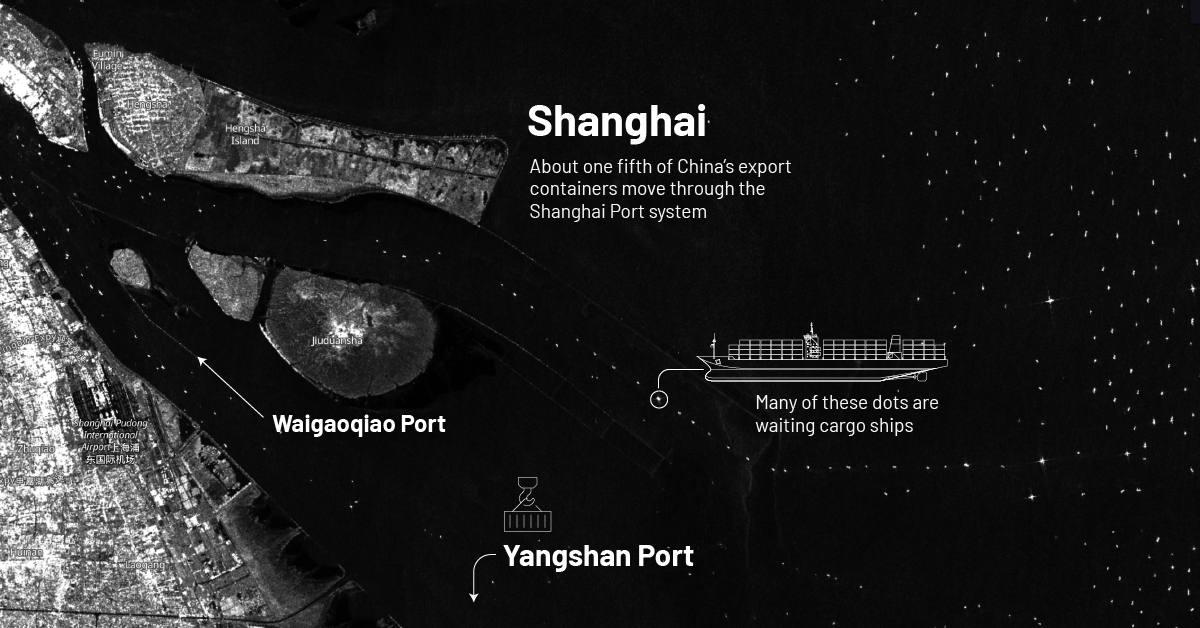
These cautionary measures have had far-reaching impacts on China’s economy, especially on its supply chain and logistics operations. Shanghai’s port system, which handles about one-fifth of China’s export containers, is currently experiencing significant delays as a result of the recent government lockdown.
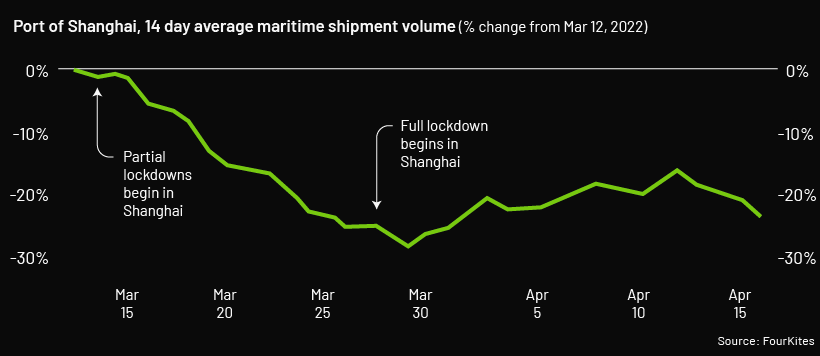
Shipping volume has dipped drastically since early March this year, right after partial lockdowns began in Shanghai. By the end of March, as restrictions continued to tighten up, shipping activity dipped nearly 30% compared to pre-lockdown levels. And while activity has recently picked up, it’s still far below average shipment volumes prior to the recent lockdown.
While the port is still technically operating, shipping delays will likely cause hiccups in the global supply chain. That’s because the Shanghai port is a major hub for international trade, and one of the largest and busiest container ports in the world.
How Bad is the Back-Up?
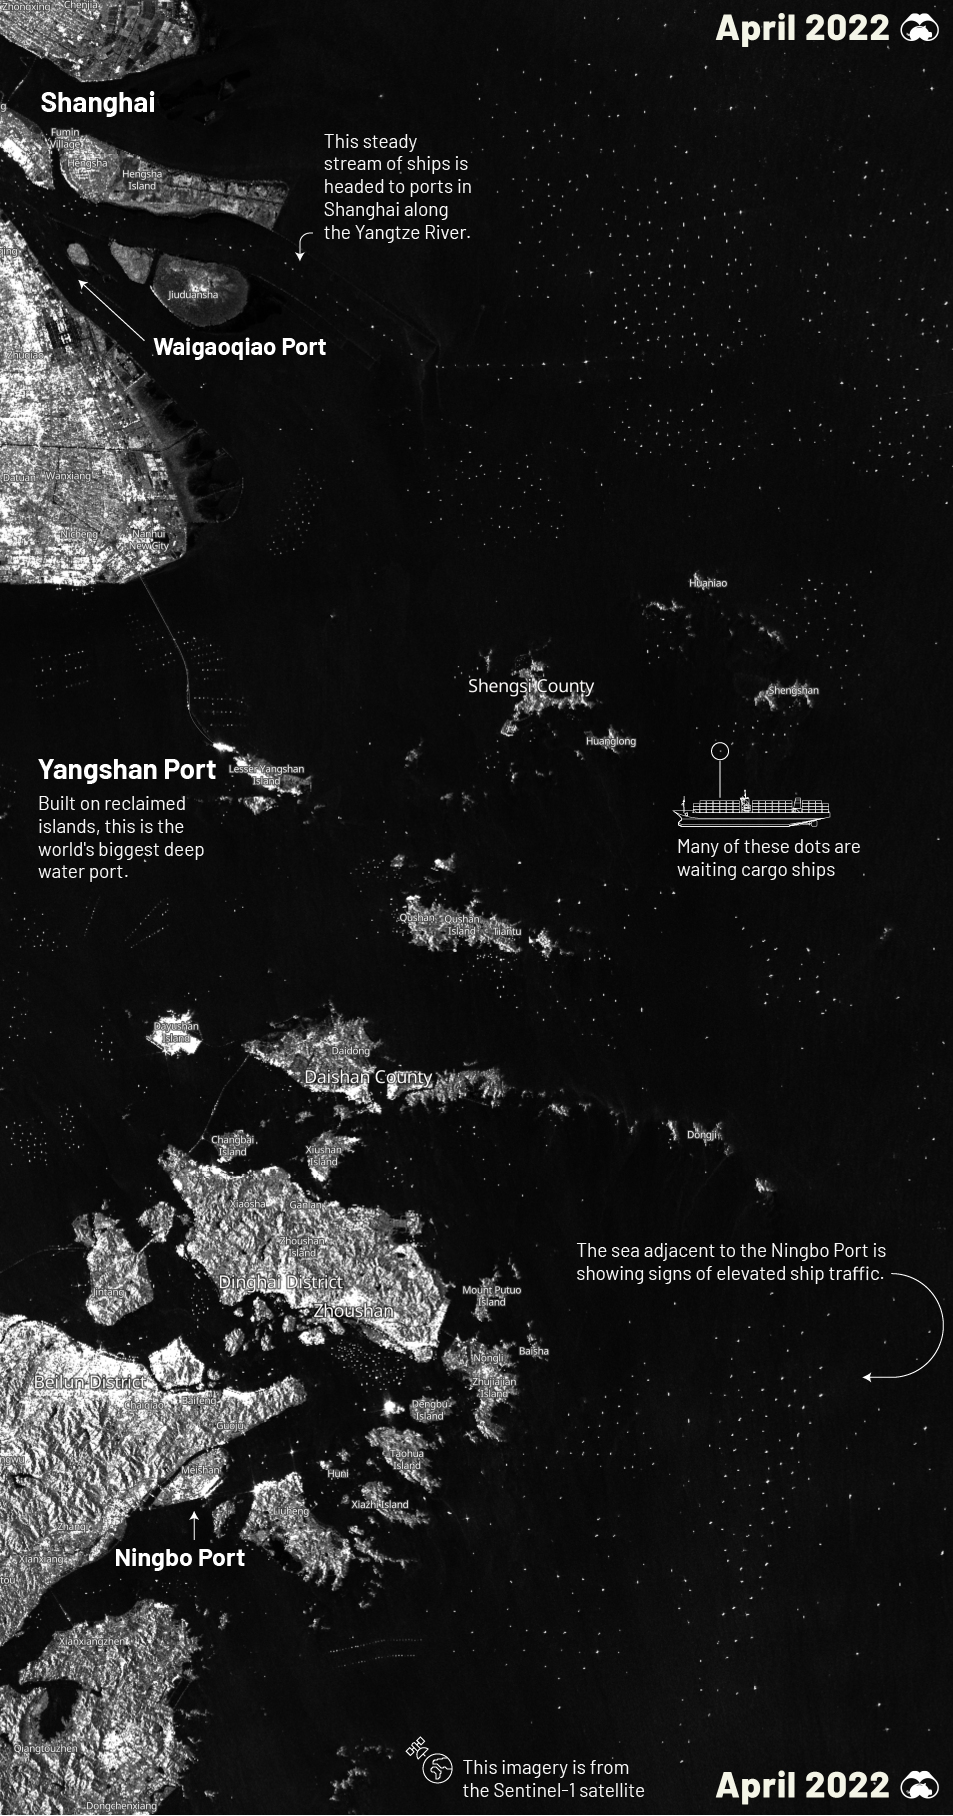
Here’s a closer look at satellite imagery that was captured by the Sentinel-1 satellite, which shows the current congestion at Shanghai’s port as of April 14, 2022. In the image, a majority of the white dots are cargo ships, many of which have been stuck in limbo for days.
Traffic has been building up at the Shanghai terminal. As of April 19, 2022, over 470 ships are still waiting to deliver goods to China. If you’d like to check out the Shanghai ports most up-to-date traffic, this live map by MarineTraffice provides real-time updates.
The number of container vessels waiting outside of Chinese ports today is 195% higher than it was in February. – Windward
Much of these delays are due to transport issues—an estimated 90% of trucks that support import and export activities are currently offline, which is causing dwell time for containers at Shanghai marine terminals to increase drastically.
Wait times for at Shanghai marine terminals has increased nearly 75% since the lockdowns began. Delays at the Shanghai terminal have sent ships to neighboring ports in Ningbo and Yangshan, but those ports are beginning to get congested as well.
The global impacts of this current bottleneck are still pending, and depend greatly on the length of Shanghai’s lockdown. According to an article in Freight Waves, this could turn into the biggest supply chain issue since the start of the pandemic if China’s marine shipping congestion isn’t cleared up soon.


Markets
U.S. Debt Interest Payments Reach $1 Trillion
U.S. debt interest payments have surged past the $1 trillion dollar mark, amid high interest rates and an ever-expanding debt burden.


U.S. Debt Interest Payments Reach $1 Trillion
This was originally posted on our Voronoi app. Download the app for free on iOS or Android and discover incredible data-driven charts from a variety of trusted sources.
The cost of paying for America’s national debt crossed the $1 trillion dollar mark in 2023, driven by high interest rates and a record $34 trillion mountain of debt.
Over the last decade, U.S. debt interest payments have more than doubled amid vast government spending during the pandemic crisis. As debt payments continue to soar, the Congressional Budget Office (CBO) reported that debt servicing costs surpassed defense spending for the first time ever this year.
This graphic shows the sharp rise in U.S. debt payments, based on data from the Federal Reserve.
A $1 Trillion Interest Bill, and Growing
Below, we show how U.S. debt interest payments have risen at a faster pace than at another time in modern history:
| Date | Interest Payments | U.S. National Debt |
|---|---|---|
| 2023 | $1.0T | $34.0T |
| 2022 | $830B | $31.4T |
| 2021 | $612B | $29.6T |
| 2020 | $518B | $27.7T |
| 2019 | $564B | $23.2T |
| 2018 | $571B | $22.0T |
| 2017 | $493B | $20.5T |
| 2016 | $460B | $20.0T |
| 2015 | $435B | $18.9T |
| 2014 | $442B | $18.1T |
| 2013 | $425B | $17.2T |
| 2012 | $417B | $16.4T |
| 2011 | $433B | $15.2T |
| 2010 | $400B | $14.0T |
| 2009 | $354B | $12.3T |
| 2008 | $380B | $10.7T |
| 2007 | $414B | $9.2T |
| 2006 | $387B | $8.7T |
| 2005 | $355B | $8.2T |
| 2004 | $318B | $7.6T |
| 2003 | $294B | $7.0T |
| 2002 | $298B | $6.4T |
| 2001 | $318B | $5.9T |
| 2000 | $353B | $5.7T |
| 1999 | $353B | $5.8T |
| 1998 | $360B | $5.6T |
| 1997 | $368B | $5.5T |
| 1996 | $362B | $5.3T |
| 1995 | $357B | $5.0T |
| 1994 | $334B | $4.8T |
| 1993 | $311B | $4.5T |
| 1992 | $306B | $4.2T |
| 1991 | $308B | $3.8T |
| 1990 | $298B | $3.4T |
| 1989 | $275B | $3.0T |
| 1988 | $254B | $2.7T |
| 1987 | $240B | $2.4T |
| 1986 | $225B | $2.2T |
| 1985 | $219B | $1.9T |
| 1984 | $205B | $1.7T |
| 1983 | $176B | $1.4T |
| 1982 | $157B | $1.2T |
| 1981 | $142B | $1.0T |
| 1980 | $113B | $930.2B |
| 1979 | $96B | $845.1B |
| 1978 | $84B | $789.2B |
| 1977 | $69B | $718.9B |
| 1976 | $61B | $653.5B |
| 1975 | $55B | $576.6B |
| 1974 | $50B | $492.7B |
| 1973 | $45B | $469.1B |
| 1972 | $39B | $448.5B |
| 1971 | $36B | $424.1B |
| 1970 | $35B | $389.2B |
| 1969 | $30B | $368.2B |
| 1968 | $25B | $358.0B |
| 1967 | $23B | $344.7B |
| 1966 | $21B | $329.3B |
Interest payments represent seasonally adjusted annual rate at the end of Q4.
At current rates, the U.S. national debt is growing by a remarkable $1 trillion about every 100 days, equal to roughly $3.6 trillion per year.
As the national debt has ballooned, debt payments even exceeded Medicaid outlays in 2023—one of the government’s largest expenditures. On average, the U.S. spent more than $2 billion per day on interest costs last year. Going further, the U.S. government is projected to spend a historic $12.4 trillion on interest payments over the next decade, averaging about $37,100 per American.
Exacerbating matters is that the U.S. is running a steep deficit, which stood at $1.1 trillion for the first six months of fiscal 2024. This has accelerated due to the 43% increase in debt servicing costs along with a $31 billion dollar increase in defense spending from a year earlier. Additionally, a $30 billion increase in funding for the Federal Deposit Insurance Corporation in light of the regional banking crisis last year was a major contributor to the deficit increase.
Overall, the CBO forecasts that roughly 75% of the federal deficit’s increase will be due to interest costs by 2034.

-

 Real Estate2 weeks ago
Visualizing America’s Shortage of Affordable Homes
-

 Technology1 week ago
Ranked: Semiconductor Companies by Industry Revenue Share
-

 Money1 week ago
Which States Have the Highest Minimum Wage in America?
-

 Real Estate1 week ago
Ranked: The Most Valuable Housing Markets in America
-

 Business1 week ago
Charted: Big Four Market Share by S&P 500 Audits
-

 AI1 week ago
The Stock Performance of U.S. Chipmakers So Far in 2024
-

 Misc2 weeks ago
Almost Every EV Stock is Down After Q1 2024
-

 Money2 weeks ago
Where Does One U.S. Tax Dollar Go?