Misc
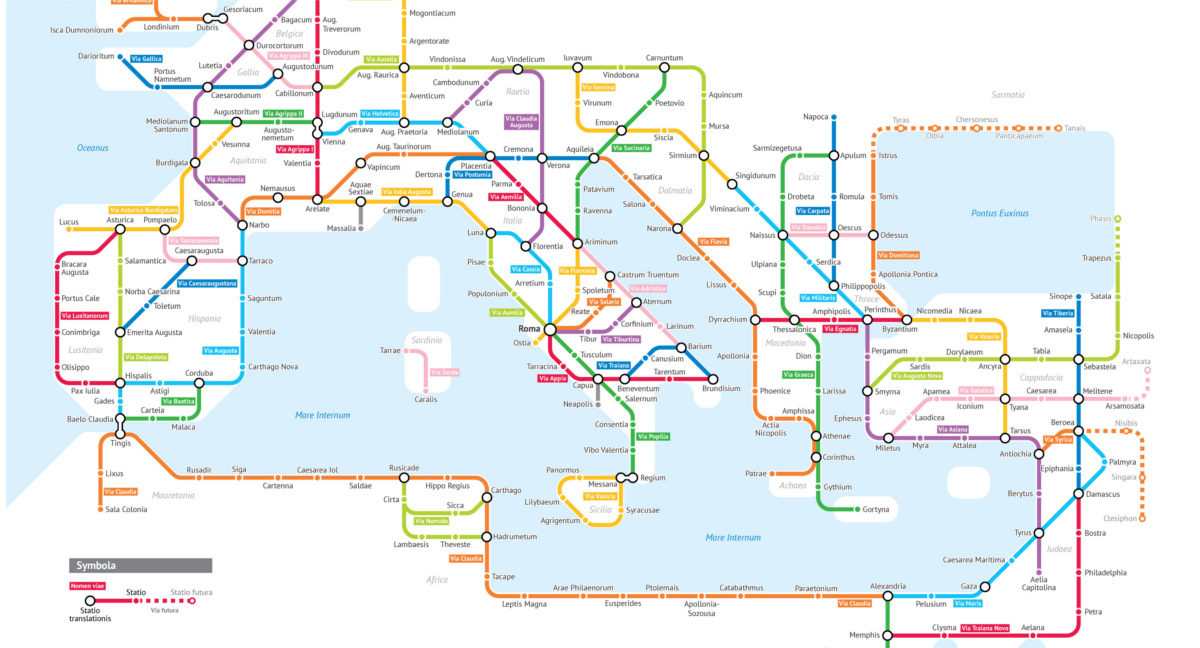
The Roman Empire’s Roads In Transit Map Form
View the full version of this graphic.
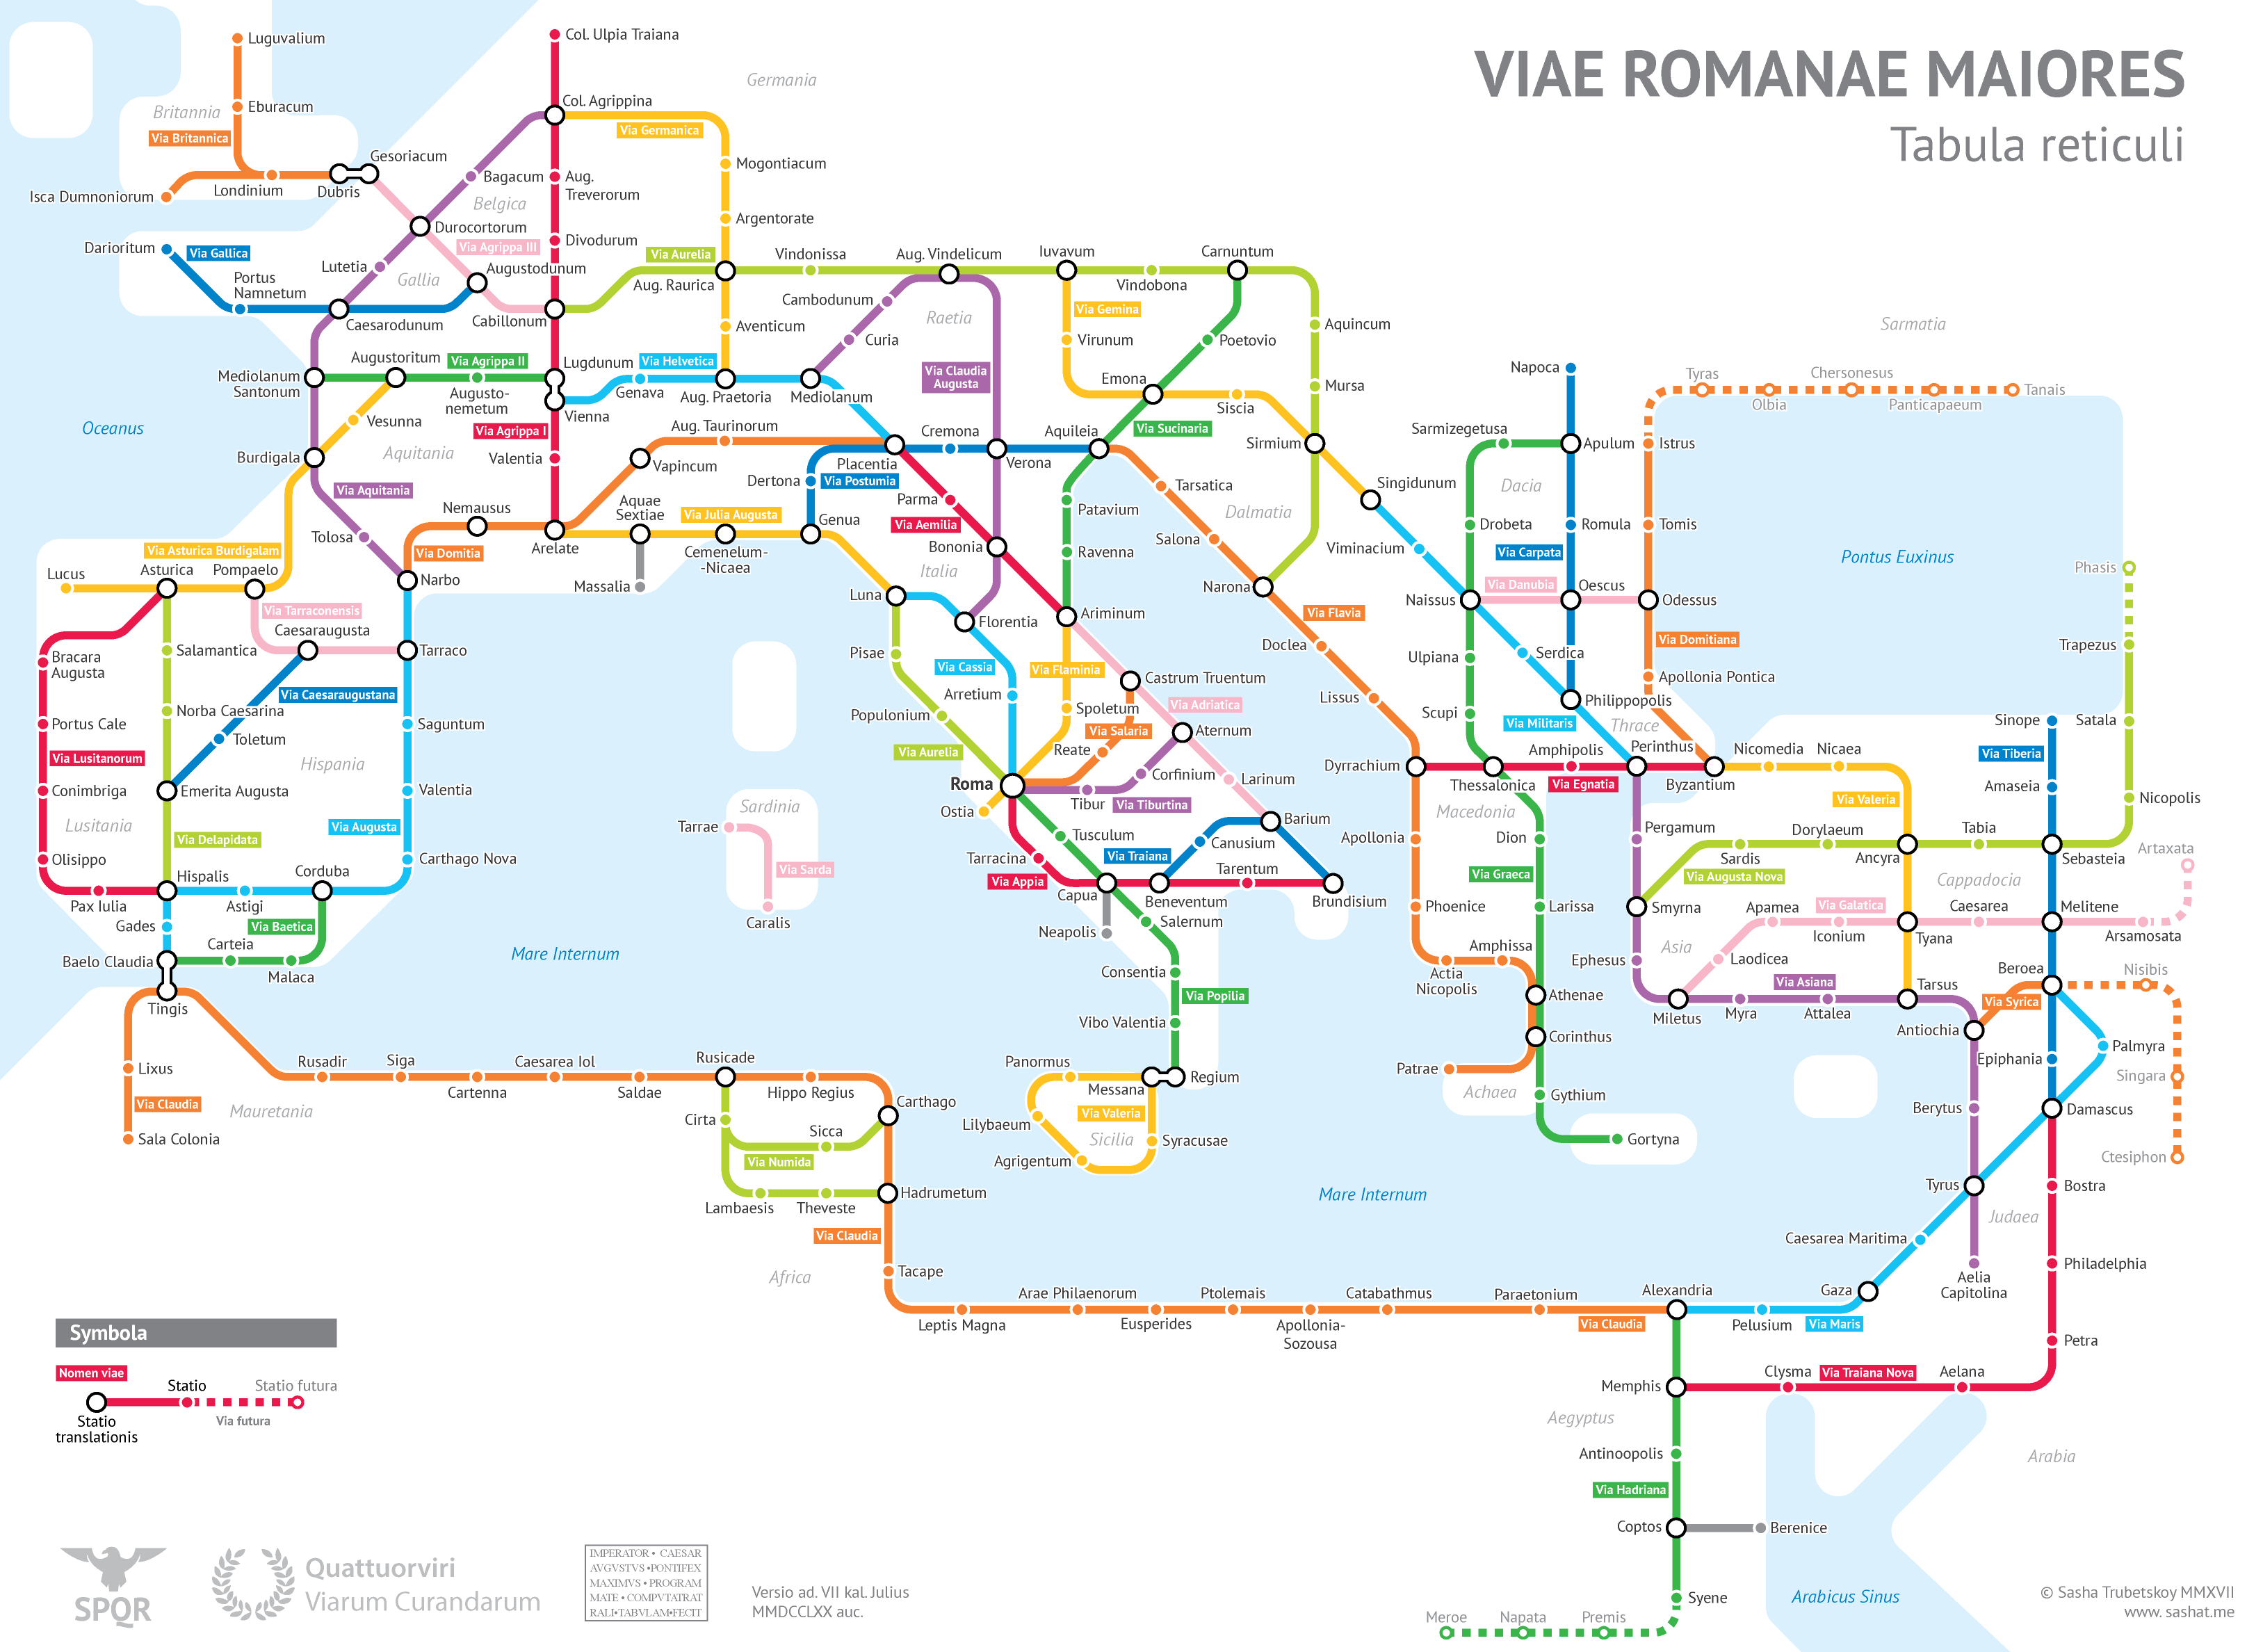
The Roman Empire’s Roads In Transit Map Form
View the high resolution version of the map by clicking here.
Unless you’re a historian or map buff, interpreting a map of the Roman Empire can be a daunting exercise. Place names are unfamiliar and roads meander across the landscape making it difficult to see the connections between specific cities and towns.
Today’s visualization, by Sasha Trubetskoy, has mashed-up two enduring obsessions – transit maps and Ancient Rome – to help us understand the connection between Rome and its sprawling empire.
At the height of the Roman Empire, there were approximately 250,000 miles (400,000 km) of roads, stretching from Northern England to Egypt and beyond. This impressive network is what allowed Rome to exercise control and communicate effectively over such a large territory.
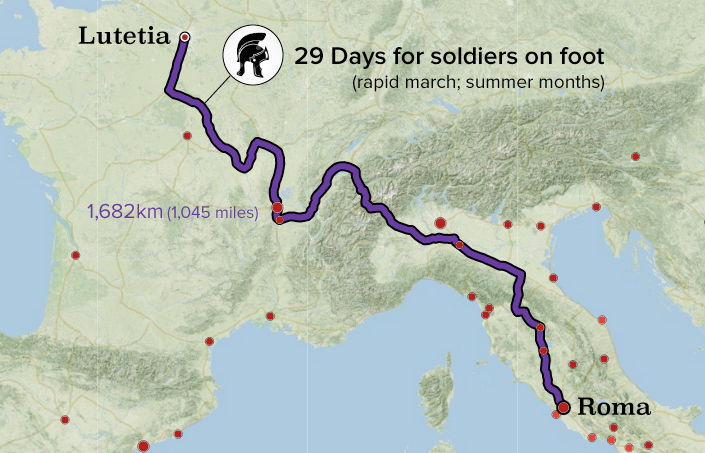
For a detailed look at travel times and costs, check out Stanford’s amazing ORBIS platform. The screenshot below shows the fastest, cheapest, and shortest routes between the settlement of Lutetia (the predecessor of present-day Paris) and Roma.
There were three main types of roads in Ancient Rome:
Viae publicae: Public highways or main roads, typically maintained by the military. These were the main, paved arteries of the empire and often included infrastructure such as drainage, milestones, and way stations.
Viae privatae: Private or country roads were financed by wealthy individuals to connect towns and other noteworthy points to the viae publicae.
Viae vicinales: These tertiary (often dirt) roads connected villages and areas within districts, eventually linking to the larger network.
This network of roads was vital as it allowed for quick troop movement as well as the development of a mail system. As the first major road network in Europe, the Romans quite literally laid the foundation for development across the continent.
There’s something alluring about Rome’s ability to carve out such a huge and advanced empire, with a legacy that lasts today.
– Sasha Trubetskoy
The Enduring Influence of Roman Roads
London, Paris, Barcelona, and countless other major cities sprang from Roman settlements along the road network, and even as Europe descended into the Dark Ages (476-800 CE), Roman roads remained as one of few functioning modes of movement and communication. A recent study even points out that proximity to that foundational network of roads even has a strong correlation with economic activity today.
Beyond mere curiosity or entertainment, looking back at Roman ingenuity allows us to see the impact their road network had on today’s world. That enduring influence is one of the reasons ancient Rome still fascinates us to this day.
For more reading, check out Trubetskoy’s followup, Roman Roads of Britain.


VC+
VC+: Get Our Key Takeaways From the IMF’s World Economic Outlook
A sneak preview of the exclusive VC+ Special Dispatch—your shortcut to understanding IMF’s World Economic Outlook report.

Have you read IMF’s latest World Economic Outlook yet? At a daunting 202 pages, we don’t blame you if it’s still on your to-do list.
But don’t worry, you don’t need to read the whole April release, because we’ve already done the hard work for you.
To save you time and effort, the Visual Capitalist team has compiled a visual analysis of everything you need to know from the report—and our upcoming VC+ Special Dispatch will be available exclusively to VC+ members on Thursday, April 25th.
If you’re not already subscribed to VC+, make sure you sign up now to receive the full analysis of the IMF report, and more (we release similar deep dives every week).
For now, here’s what VC+ members can expect to receive.
Your Shortcut to Understanding IMF’s World Economic Outlook
With long and short-term growth prospects declining for many countries around the world, this Special Dispatch offers a visual analysis of the key figures and takeaways from the IMF’s report including:
- The global decline in economic growth forecasts
- Real GDP growth and inflation forecasts for major nations in 2024
- When interest rate cuts will happen and interest rate forecasts
- How debt-to-GDP ratios have changed since 2000
- And much more!

Get the Full Breakdown in the Next VC+ Special Dispatch
VC+ members will receive the full Special Dispatch on Thursday, April 25th.
Make sure you join VC+ now to receive exclusive charts and the full analysis of key takeaways from IMF’s World Economic Outlook.
Don’t miss out. Become a VC+ member today.
What You Get When You Become a VC+ Member
VC+ is Visual Capitalist’s premium subscription. As a member, you’ll get the following:
- Special Dispatches: Deep dive visual briefings on crucial reports and global trends
- Markets This Month: A snappy summary of the state of the markets and what to look out for
- The Trendline: Weekly curation of the best visualizations from across the globe
- Global Forecast Series: Our flagship annual report that covers everything you need to know related to the economy, markets, geopolitics, and the latest tech trends
- VC+ Archive: Hundreds of previously released VC+ briefings and reports that you’ve been missing out on, all in one dedicated hub
You can get all of the above, and more, by joining VC+ today.

-

 Markets1 week ago
U.S. Debt Interest Payments Reach $1 Trillion
-

 Business2 weeks ago
Charted: Big Four Market Share by S&P 500 Audits
-

 Real Estate2 weeks ago
Ranked: The Most Valuable Housing Markets in America
-

 Money2 weeks ago
Which States Have the Highest Minimum Wage in America?
-

 AI2 weeks ago
Ranked: Semiconductor Companies by Industry Revenue Share
-

 Markets2 weeks ago
Ranked: The World’s Top Flight Routes, by Revenue
-

 Demographics2 weeks ago
Population Projections: The World’s 6 Largest Countries in 2075
-

 Markets2 weeks ago
The Top 10 States by Real GDP Growth in 2023