Technology
The Rising Speed of Technological Adoption
The Rising Speed of Technological Adoption
Technological progress is not the only thing rising at an exponential rate.
The rate at which newly commercialized technologies get adopted by consumers is also getting faster, too.
In the modern world, through increased connectivity, instant communication, and established infrastructure systems, new ideas and products can spread at speeds never seen before – and this enables a new product to get in the hands of consumers in the blink of an eye.
Visualizing Technological Adoption
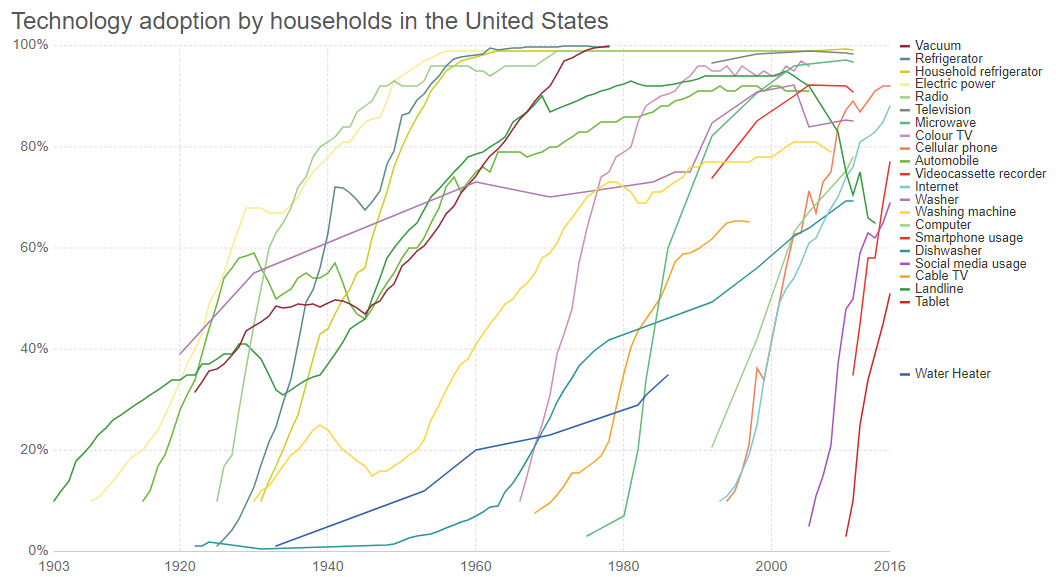
Today’s dynamic chart comes to us from Our World in Data, and it allows you to compare the adoption rates of new technologies over the period of more than a century.
In addition to the technologies you’ll find embedded on the initial chart above, you can also use the “Add technology” tab of the chart (bottom left) to list up to 40 tech data series on the chart in total. This allows you to gauge adoption rates for everything from color televisions to washing machines, while giving you an idea of the trajectory of many common technologies today.
A Blast From the Past
To get the full impact of the chart, it’s worth removing more modern technologies like smartphones, social media, tablets, cellular phones, and the internet from the list.
Here’s a look at adoption rates for the household appliances and products today that we would consider pretty essential, over a period of more than 120 years:
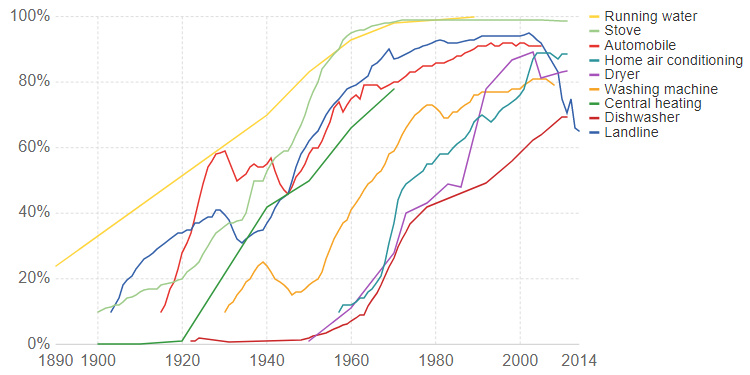
The telephone was invented in 1876, but it wasn’t until a century later that landlines reached a saturation point in households.
For this to happen, massive amounts of infrastructure had to be built and network effects also needed to accumulate to make the product worthwhile for consumers. Further, the telephone suffered from the “last-mile problem”, in which the logistics get tougher and more expensive as end-users get hooked up to a network.
As a result, it wasn’t until the 1960s that 80% of U.S. households had landlines in them.
New Adoption Speeds
Now, here’s a chart with many older technologies removed – keep in mind that the x axis has changed to a much shorter timespan (~65 years):
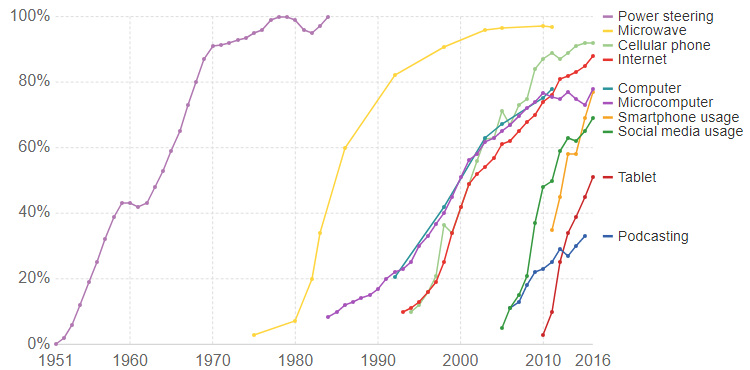
Microwaves, cell phones, smartphones, social media, tablets, and other inventions from the modern era all show fast-rising adoption rates. Standing out most on the chart is the tablet computer, which went from nearly 0% to 50% adoption in five years or so.
Why do newer technologies get adopted so quickly? It seems partly because modern tech needs less infrastructure in contrast with the water pipes, cable lines, electricity grids, and telephone wires that had to be installed throughout the 20th century.
However, it also says something else about today’s consumers – which is that they are connected, fast-acting, and not afraid to adopt the new technologies that can quickly impact their lives for the better.


Technology
Visualizing AI Patents by Country
See which countries have been granted the most AI patents each year, from 2012 to 2022.


Visualizing AI Patents by Country
This was originally posted on our Voronoi app. Download the app for free on iOS or Android and discover incredible data-driven charts from a variety of trusted sources.
This infographic shows the number of AI-related patents granted each year from 2010 to 2022 (latest data available). These figures come from the Center for Security and Emerging Technology (CSET), accessed via Stanford University’s 2024 AI Index Report.
From this data, we can see that China first overtook the U.S. in 2013. Since then, the country has seen enormous growth in the number of AI patents granted each year.
| Year | China | EU and UK | U.S. | RoW | Global Total |
|---|---|---|---|---|---|
| 2010 | 307 | 137 | 984 | 571 | 1,999 |
| 2011 | 516 | 129 | 980 | 581 | 2,206 |
| 2012 | 926 | 112 | 950 | 660 | 2,648 |
| 2013 | 1,035 | 91 | 970 | 627 | 2,723 |
| 2014 | 1,278 | 97 | 1,078 | 667 | 3,120 |
| 2015 | 1,721 | 110 | 1,135 | 539 | 3,505 |
| 2016 | 1,621 | 128 | 1,298 | 714 | 3,761 |
| 2017 | 2,428 | 144 | 1,489 | 1,075 | 5,136 |
| 2018 | 4,741 | 155 | 1,674 | 1,574 | 8,144 |
| 2019 | 9,530 | 322 | 3,211 | 2,720 | 15,783 |
| 2020 | 13,071 | 406 | 5,441 | 4,455 | 23,373 |
| 2021 | 21,907 | 623 | 8,219 | 7,519 | 38,268 |
| 2022 | 35,315 | 1,173 | 12,077 | 13,699 | 62,264 |
In 2022, China was granted more patents than every other country combined.
While this suggests that the country is very active in researching the field of artificial intelligence, it doesn’t necessarily mean that China is the farthest in terms of capability.
Key Facts About AI Patents
According to CSET, AI patents relate to mathematical relationships and algorithms, which are considered abstract ideas under patent law. They can also have different meaning, depending on where they are filed.
In the U.S., AI patenting is concentrated amongst large companies including IBM, Microsoft, and Google. On the other hand, AI patenting in China is more distributed across government organizations, universities, and tech firms (e.g. Tencent).
In terms of focus area, China’s patents are typically related to computer vision, a field of AI that enables computers and systems to interpret visual data and inputs. Meanwhile America’s efforts are more evenly distributed across research fields.
Learn More About AI From Visual Capitalist
If you want to see more data visualizations on artificial intelligence, check out this graphic that shows which job departments will be impacted by AI the most.

-

 Markets1 week ago
U.S. Debt Interest Payments Reach $1 Trillion
-

 Markets2 weeks ago
Ranked: The Most Valuable Housing Markets in America
-

 Money2 weeks ago
Which States Have the Highest Minimum Wage in America?
-

 AI2 weeks ago
Ranked: Semiconductor Companies by Industry Revenue Share
-

 Markets2 weeks ago
Ranked: The World’s Top Flight Routes, by Revenue
-

 Countries2 weeks ago
Population Projections: The World’s 6 Largest Countries in 2075
-

 Markets2 weeks ago
The Top 10 States by Real GDP Growth in 2023
-

 Money2 weeks ago
The Smallest Gender Wage Gaps in OECD Countries