Markets
Does “Made in America” Still Matter to Consumers?
Does “Made in America” Still Matter to Consumers?
Do American citizens care where their products come from? Well, it depends on who you ask.
Over the past few decades, the importance of “Made in America”—labels on products indicating production was done in the U.S.—has ebbed and flowed.
As China has grown into the United States’ economic rival and geopolitical adversary, the distinction between American-made and Chinese-made has resurfaced, even as some products have been mislabeled or locally produced but Chinese-owned.
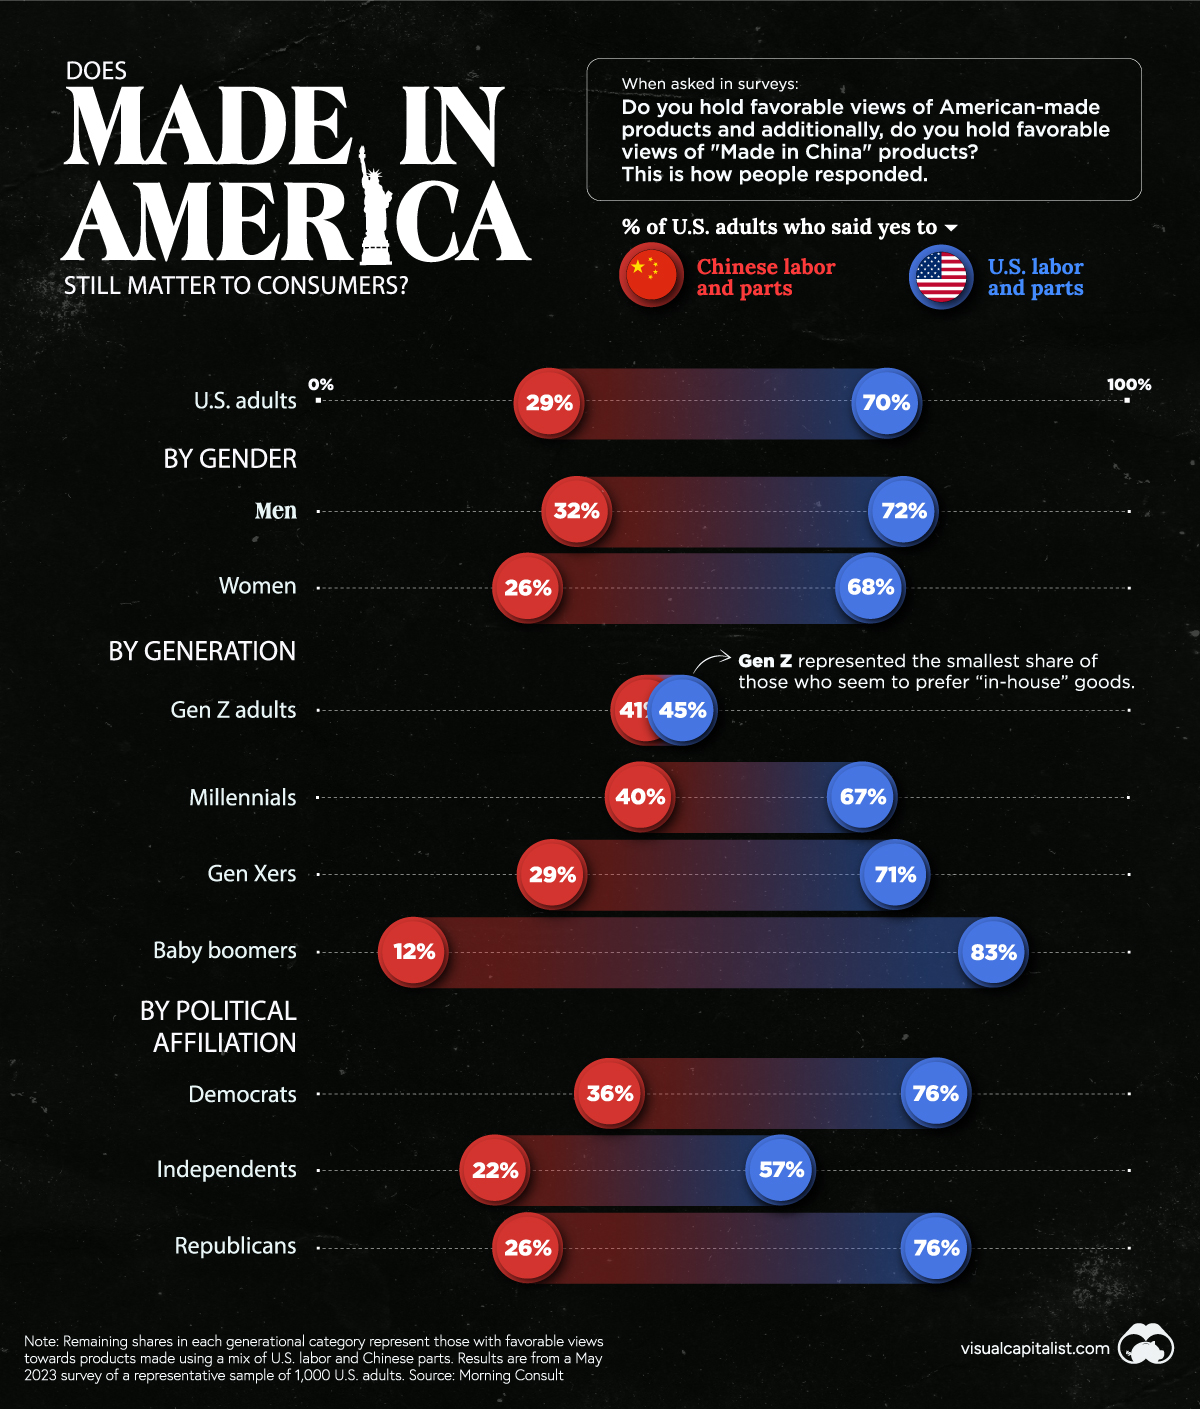
How do people currently feel? This chart uses survey responses from May 2023 out of Morning Consult, in which a representative sample of 1,000 U.S. adults were questioned on whether they had favorable views of products from U.S. companies using American or Chinese labor and parts.
Who Prefers American-Made?
According to the report, companies that choose to move production state-side will experience reputational gains with American consumers.
In fact, around two-thirds of survey respondents said they regularly sought out products that were “Made in America” during the last year. But there were slight divides in gender (men favored American-made products more) and noticeable divides in generational responses.
Here’s a look at the data on how different demographic groups valued national goods:
| Generation | Favorable View of Chinese-Made Products | Favorable View of American-Made Products |
|---|---|---|
| Gen Z | 41% | 45% |
| Millennials | 40% | 67% |
| Gen X | 29% | 71% |
| Boomers | 12% | 83% |
| U.S. Adults Total | 29% | 70% |
Overall, thee older generations like baby boomers tend to be more patriotic in their purchasing opinions, with Gen Z being the least concerned with Chinese products.
On the political spectrum, both Democrats and Republicans had the exact same share of respondents who favor American-made products at 76%. Comparatively, only 57% of independents favored American-made products, though they also responded least favorably to Chinese-made products at 22%.
One other interesting point to come out of the survey: close to 50% of consumers said they would actually be willing to pay more for American-made products.
The American Goods Market
Looking at responses from U.S. adults overall, large shares of consumers are leaning towards domestic-made goods. Here are some additional insights worth considering:
- 65% of U.S. adult consumers claimed to sometimes or always buy “Made in America” products intentionally
- 43% prioritize purchasing American-made products rather than prioritizing other options like quality, sustainability, or affordability
- 48% are willing to pay higher amounts for U.S.-based products. 39% responded they would pay between 6%-10% more for said products
Overall, it appears that “in-house” goods are more desirable to Americans in the current environment. This also explains why regionalization is becoming more important for companies, whether in terms of reshoring (or onshoring) production back to America, or “nearshoring” to Mexico and closer neighbors.


Markets
U.S. Debt Interest Payments Reach $1 Trillion
U.S. debt interest payments have surged past the $1 trillion dollar mark, amid high interest rates and an ever-expanding debt burden.


U.S. Debt Interest Payments Reach $1 Trillion
This was originally posted on our Voronoi app. Download the app for free on iOS or Android and discover incredible data-driven charts from a variety of trusted sources.
The cost of paying for America’s national debt crossed the $1 trillion dollar mark in 2023, driven by high interest rates and a record $34 trillion mountain of debt.
Over the last decade, U.S. debt interest payments have more than doubled amid vast government spending during the pandemic crisis. As debt payments continue to soar, the Congressional Budget Office (CBO) reported that debt servicing costs surpassed defense spending for the first time ever this year.
This graphic shows the sharp rise in U.S. debt payments, based on data from the Federal Reserve.
A $1 Trillion Interest Bill, and Growing
Below, we show how U.S. debt interest payments have risen at a faster pace than at another time in modern history:
| Date | Interest Payments | U.S. National Debt |
|---|---|---|
| 2023 | $1.0T | $34.0T |
| 2022 | $830B | $31.4T |
| 2021 | $612B | $29.6T |
| 2020 | $518B | $27.7T |
| 2019 | $564B | $23.2T |
| 2018 | $571B | $22.0T |
| 2017 | $493B | $20.5T |
| 2016 | $460B | $20.0T |
| 2015 | $435B | $18.9T |
| 2014 | $442B | $18.1T |
| 2013 | $425B | $17.2T |
| 2012 | $417B | $16.4T |
| 2011 | $433B | $15.2T |
| 2010 | $400B | $14.0T |
| 2009 | $354B | $12.3T |
| 2008 | $380B | $10.7T |
| 2007 | $414B | $9.2T |
| 2006 | $387B | $8.7T |
| 2005 | $355B | $8.2T |
| 2004 | $318B | $7.6T |
| 2003 | $294B | $7.0T |
| 2002 | $298B | $6.4T |
| 2001 | $318B | $5.9T |
| 2000 | $353B | $5.7T |
| 1999 | $353B | $5.8T |
| 1998 | $360B | $5.6T |
| 1997 | $368B | $5.5T |
| 1996 | $362B | $5.3T |
| 1995 | $357B | $5.0T |
| 1994 | $334B | $4.8T |
| 1993 | $311B | $4.5T |
| 1992 | $306B | $4.2T |
| 1991 | $308B | $3.8T |
| 1990 | $298B | $3.4T |
| 1989 | $275B | $3.0T |
| 1988 | $254B | $2.7T |
| 1987 | $240B | $2.4T |
| 1986 | $225B | $2.2T |
| 1985 | $219B | $1.9T |
| 1984 | $205B | $1.7T |
| 1983 | $176B | $1.4T |
| 1982 | $157B | $1.2T |
| 1981 | $142B | $1.0T |
| 1980 | $113B | $930.2B |
| 1979 | $96B | $845.1B |
| 1978 | $84B | $789.2B |
| 1977 | $69B | $718.9B |
| 1976 | $61B | $653.5B |
| 1975 | $55B | $576.6B |
| 1974 | $50B | $492.7B |
| 1973 | $45B | $469.1B |
| 1972 | $39B | $448.5B |
| 1971 | $36B | $424.1B |
| 1970 | $35B | $389.2B |
| 1969 | $30B | $368.2B |
| 1968 | $25B | $358.0B |
| 1967 | $23B | $344.7B |
| 1966 | $21B | $329.3B |
Interest payments represent seasonally adjusted annual rate at the end of Q4.
At current rates, the U.S. national debt is growing by a remarkable $1 trillion about every 100 days, equal to roughly $3.6 trillion per year.
As the national debt has ballooned, debt payments even exceeded Medicaid outlays in 2023—one of the government’s largest expenditures. On average, the U.S. spent more than $2 billion per day on interest costs last year. Going further, the U.S. government is projected to spend a historic $12.4 trillion on interest payments over the next decade, averaging about $37,100 per American.
Exacerbating matters is that the U.S. is running a steep deficit, which stood at $1.1 trillion for the first six months of fiscal 2024. This has accelerated due to the 43% increase in debt servicing costs along with a $31 billion dollar increase in defense spending from a year earlier. Additionally, a $30 billion increase in funding for the Federal Deposit Insurance Corporation in light of the regional banking crisis last year was a major contributor to the deficit increase.
Overall, the CBO forecasts that roughly 75% of the federal deficit’s increase will be due to interest costs by 2034.

-

 Travel1 week ago
Airline Incidents: How Do Boeing and Airbus Compare?
-

 Markets3 weeks ago
Visualizing America’s Shortage of Affordable Homes
-

 Green2 weeks ago
Ranked: Top Countries by Total Forest Loss Since 2001
-

 Money2 weeks ago
Where Does One U.S. Tax Dollar Go?
-

 Misc2 weeks ago
Almost Every EV Stock is Down After Q1 2024
-

 AI2 weeks ago
The Stock Performance of U.S. Chipmakers So Far in 2024
-

 Markets2 weeks ago
Charted: Big Four Market Share by S&P 500 Audits
-

 Real Estate2 weeks ago
Ranked: The Most Valuable Housing Markets in America