Markets
Chart: The Rise of ETFs and Passive Investing
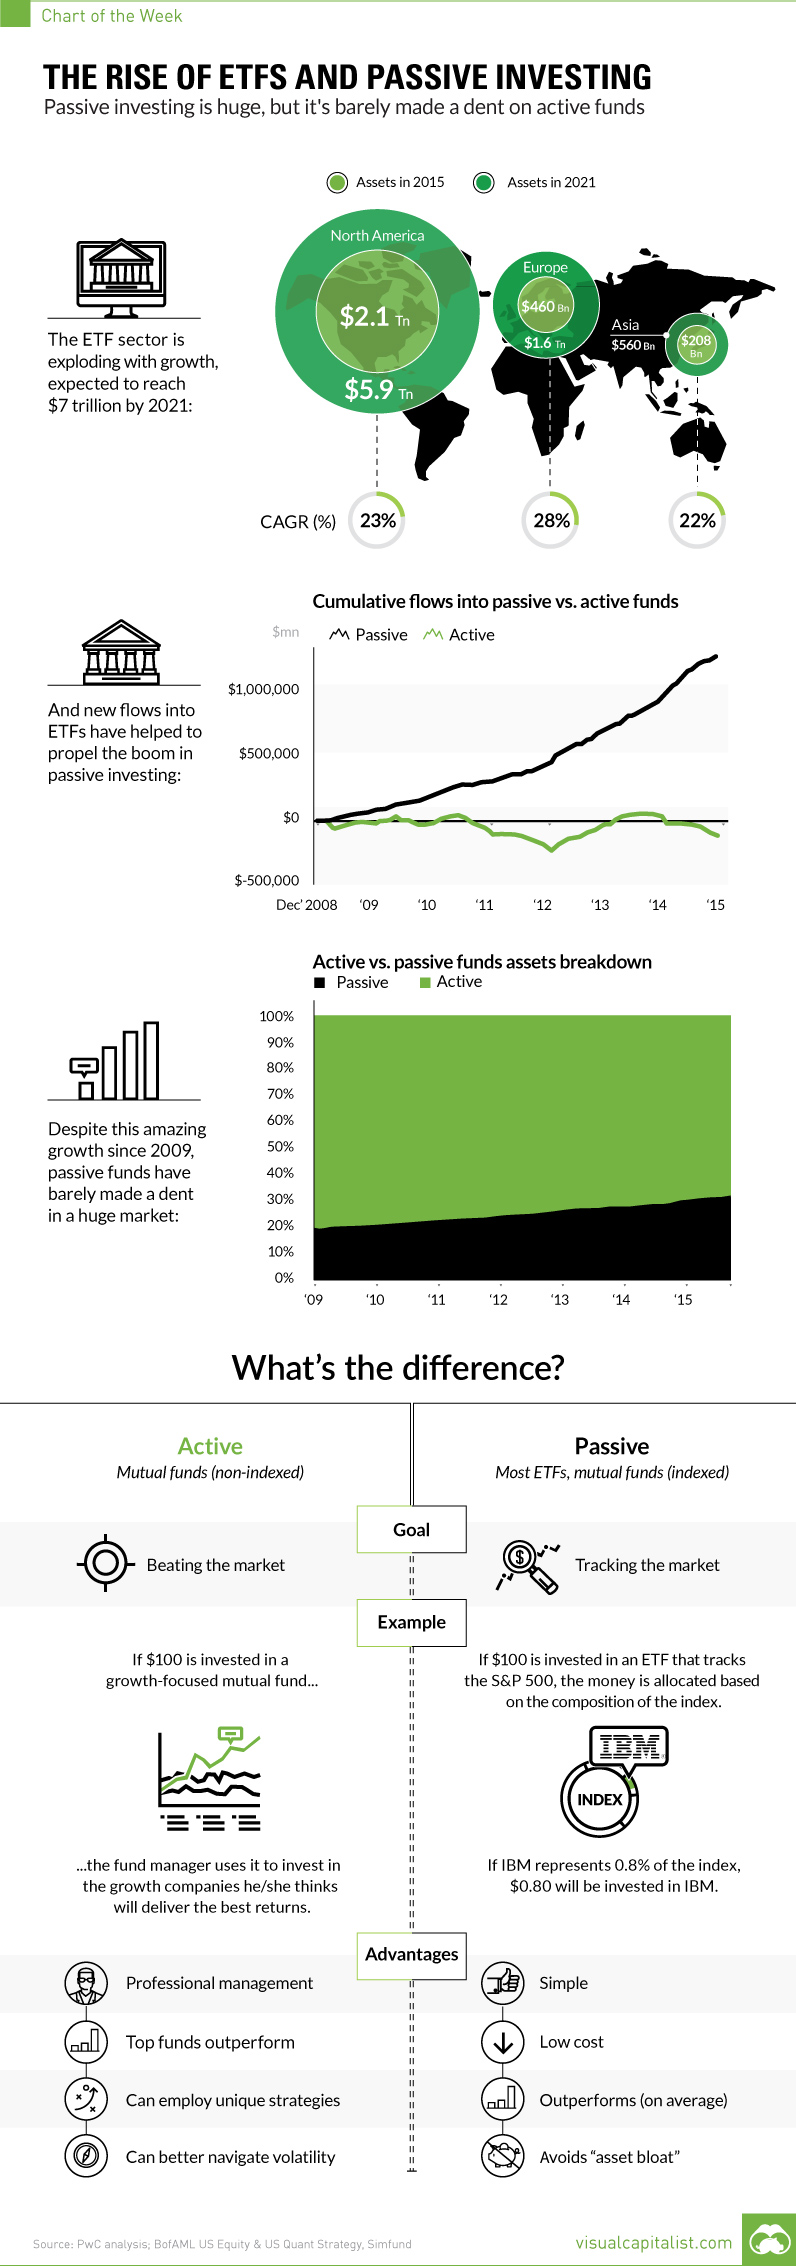
Rise of ETFs and Passive Investing
Passive investing is huge, but it’s barely made a dent on active
The Chart of the Week is a weekly Visual Capitalist feature on Fridays.
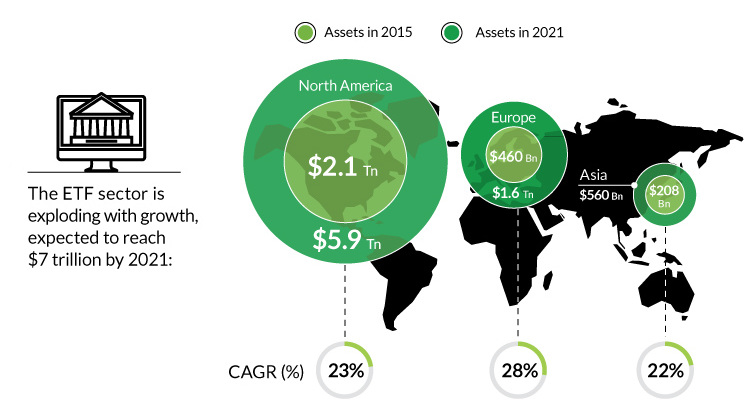
For the investing world, the meteoric rise of ETFs, or exchange-traded funds, has been a key story to follow since the 2008 crisis.
The ETF landscape has changed dramatically over that timeframe. In 2007, there were 1,181 ETFs that existed worldwide. By 2015, that number sailed to 4,396 – that’s a lot of new ETFs. Today, there is so much selection out there that you can do pretty much everything.
Want to go 2x short oil? Then try the ProShares UltraShort Bloomberg Crude Oil ETF (SCO). Want to buy into the cybersecurity boom? Try the PureFunds Cybersecurity ETF (HACK). Want to focus in on a specific geographic region such as Singapore? Don’t worry, the iShares MSCI Singapore ETF (EWS) gets you precise exposure to large and mid-sized Singaporean companies.
You get the idea.
Part of a Bigger Trend
Even though the global ETF market is estimated to be worth $7 trillion by 2021, the ETF craze is actually part of a much bigger trend towards putting money into passive funds.
Passive funds aim to “track” a specific market, by allocating dollars in equal proportion to an index. This is in contrast to active funds, which employ professional managers who try to beat the market by having more discretion in choosing which securities make up a portfolio.
The vast majority of ETFs fit in the former category, and passive investing has been on a roll since the Financial Crisis. In 2015, for example, $413.8 billion was poured into passive funds, while $207.3 billion was pulled out of U.S. mutual funds with active management.
Passive or Active?
Why have ETFs and passive investing been so popular? In general, it is because many active managers have struggled to beat the market as a whole in recent years.
However, there are some important caveats worth considering.
First, while most managers fail to beat the market, some of them do succeed. Financial planners will be the first to tell you that there are revered mutual funds out there that do often perform to the upside.
Next, passive funds have also profited off of the extreme and unprecedented actions taken by central banks. Since the crisis, central banks have experimented by pumping trillions of dollars of liquidity into the system, creating a very unusual market situation. With the cost of borrowing at record lows, valuations have become extremely distorted in the market. This careful balancing act by central banks benefits passive investors until it blows up.
Lastly, low volatility by definition means smaller price movements that active managers can capitalize on. If the volatility environment changes, passive funds may lose a level of attractiveness as there are more winners and losers at any given time.


Economy
Economic Growth Forecasts for G7 and BRICS Countries in 2024
The IMF has released its economic growth forecasts for 2024. How do the G7 and BRICS countries compare?


G7 & BRICS Real GDP Growth Forecasts for 2024
The International Monetary Fund’s (IMF) has released its real gross domestic product (GDP) growth forecasts for 2024, and while global growth is projected to stay steady at 3.2%, various major nations are seeing declining forecasts.
This chart visualizes the 2024 real GDP growth forecasts using data from the IMF’s 2024 World Economic Outlook for G7 and BRICS member nations along with Saudi Arabia, which is still considering an invitation to join the bloc.
Get the Key Insights of the IMF’s World Economic Outlook
Want a visual breakdown of the insights from the IMF’s 2024 World Economic Outlook report?
This visual is part of a special dispatch of the key takeaways exclusively for VC+ members.
Get the full dispatch of charts by signing up to VC+.
Mixed Economic Growth Prospects for Major Nations in 2024
Economic growth projections by the IMF for major nations are mixed, with the majority of G7 and BRICS countries forecasted to have slower growth in 2024 compared to 2023.
Only three BRICS-invited or member countries, Saudi Arabia, the UAE, and South Africa, have higher projected real GDP growth rates in 2024 than last year.
| Group | Country | Real GDP Growth (2023) | Real GDP Growth (2024P) |
|---|---|---|---|
| G7 | 🇺🇸 U.S. | 2.5% | 2.7% |
| G7 | 🇨🇦 Canada | 1.1% | 1.2% |
| G7 | 🇯🇵 Japan | 1.9% | 0.9% |
| G7 | 🇫🇷 France | 0.9% | 0.7% |
| G7 | 🇮🇹 Italy | 0.9% | 0.7% |
| G7 | 🇬🇧 UK | 0.1% | 0.5% |
| G7 | 🇩🇪 Germany | -0.3% | 0.2% |
| BRICS | 🇮🇳 India | 7.8% | 6.8% |
| BRICS | 🇨🇳 China | 5.2% | 4.6% |
| BRICS | 🇦🇪 UAE | 3.4% | 3.5% |
| BRICS | 🇮🇷 Iran | 4.7% | 3.3% |
| BRICS | 🇷🇺 Russia | 3.6% | 3.2% |
| BRICS | 🇪🇬 Egypt | 3.8% | 3.0% |
| BRICS-invited | 🇸🇦 Saudi Arabia | -0.8% | 2.6% |
| BRICS | 🇧🇷 Brazil | 2.9% | 2.2% |
| BRICS | 🇿🇦 South Africa | 0.6% | 0.9% |
| BRICS | 🇪🇹 Ethiopia | 7.2% | 6.2% |
| 🌍 World | 3.2% | 3.2% |
China and India are forecasted to maintain relatively high growth rates in 2024 at 4.6% and 6.8% respectively, but compared to the previous year, China is growing 0.6 percentage points slower while India is an entire percentage point slower.
On the other hand, four G7 nations are set to grow faster than last year, which includes Germany making its comeback from its negative real GDP growth of -0.3% in 2023.
Faster Growth for BRICS than G7 Nations
Despite mostly lower growth forecasts in 2024 compared to 2023, BRICS nations still have a significantly higher average growth forecast at 3.6% compared to the G7 average of 1%.
While the G7 countries’ combined GDP is around $15 trillion greater than the BRICS nations, with continued higher growth rates and the potential to add more members, BRICS looks likely to overtake the G7 in economic size within two decades.
BRICS Expansion Stutters Before October 2024 Summit
BRICS’ recent expansion has stuttered slightly, as Argentina’s newly-elected president Javier Milei declined its invitation and Saudi Arabia clarified that the country is still considering its invitation and has not joined BRICS yet.
Even with these initial growing pains, South Africa’s Foreign Minister Naledi Pandor told reporters in February that 34 different countries have submitted applications to join the growing BRICS bloc.
Any changes to the group are likely to be announced leading up to or at the 2024 BRICS summit which takes place October 22-24 in Kazan, Russia.
Get the Full Analysis of the IMF’s Outlook on VC+
This visual is part of an exclusive special dispatch for VC+ members which breaks down the key takeaways from the IMF’s 2024 World Economic Outlook.
For the full set of charts and analysis, sign up for VC+.

-

 Markets1 week ago
U.S. Debt Interest Payments Reach $1 Trillion
-

 Markets2 weeks ago
Ranked: The Most Valuable Housing Markets in America
-

 Money2 weeks ago
Which States Have the Highest Minimum Wage in America?
-

 AI2 weeks ago
Ranked: Semiconductor Companies by Industry Revenue Share
-

 Markets2 weeks ago
Ranked: The World’s Top Flight Routes, by Revenue
-

 Countries2 weeks ago
Population Projections: The World’s 6 Largest Countries in 2075
-

 Markets2 weeks ago
The Top 10 States by Real GDP Growth in 2023
-

 Money2 weeks ago
The Smallest Gender Wage Gaps in OECD Countries