Technology
The Rise and Fall of Social Media Platforms
The Rise and Fall of Social Media Platforms
Since its inception, the internet has played a pivotal role in connecting people across the globe, including in remote locations.
While the foundational need for human connection hasn’t changed, platforms and technology continue to evolve, even today. Faster internet connections and mobile devices have made social networks a ubiquitous part of our lives, with the time spent on social media each day creeping ever upward.
The Scoreboard Today
Over the last 15 years, billions of people around the world have jumped onto the social media bandwagon – and platforms have battled for our attention spans by inventing (and sometimes flat-out stealing) features to keep people engaged.
Here’s a snapshot of where things stand today:
| Global Rank | Social Platform | Parent Company | Monthly Active Users |
|---|---|---|---|
| 1 | 2.2 billion | ||
| 2 | 1.1 billion | ||
| 3 | Qzone | 🇨🇳 Tencent | 528 million |
| 4 | 🇨🇳 Sina Corp | 528 million | |
| 5 | TikTok | 🇨🇳 ByteDance | 524 million |
| 6 | 340 million | ||
| 7 | 329 million | ||
| 8 | Snapchat | 🇺🇸 Snap Inc | 302 million |
| 9 | 🇺🇸 Microsoft | 260 million |
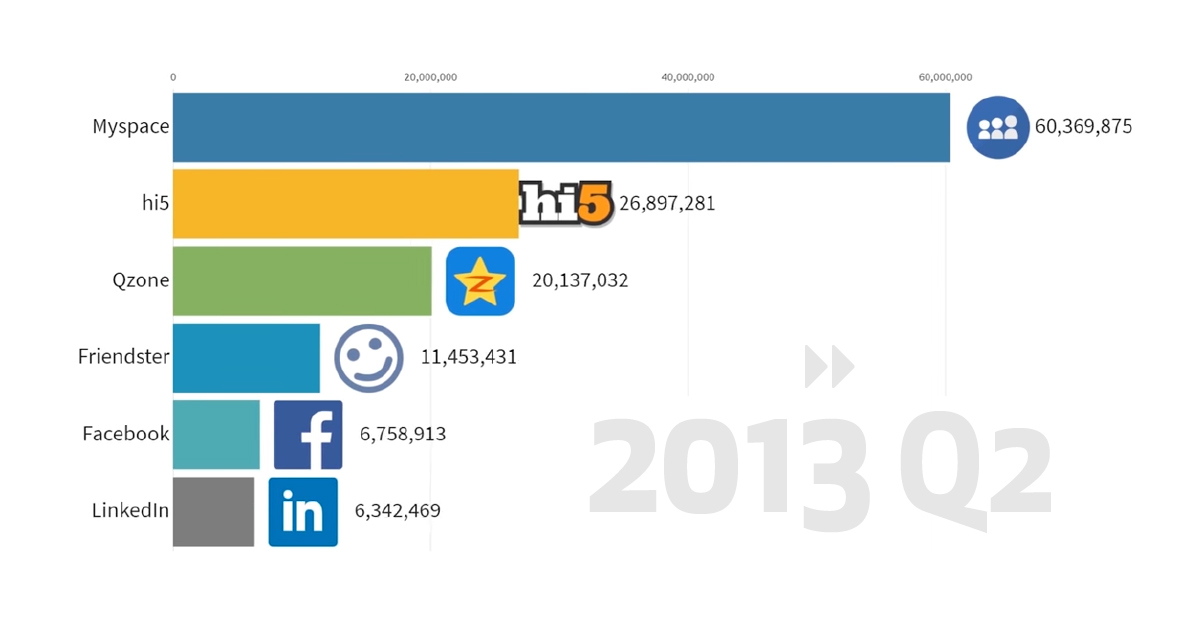
Today’s entertaining video, from the Data is Beautiful YouTube channel, is a look back at the rise and fall of social media platforms – and possibly a glimpse at the future of social media as well.
Below we respond to some key questions and observations raised by this video overview.
Points of Interest
1. What is QZone?
Qzone is China’s largest social network. The platform originally evolved as a sort of blogging service that sprang from QQ, China’s seminal instant messaging service. While Qzone is still one of the world’s largest social media sites – it still attracts around half a billion users per month – WeChat is now the service of choice for almost everyone in China with a smartphone.
2. LinkedIn has been around for a long time.
It’s true. LinkedIn, which hasn’t left the top 10 list since 2003, is a textbook example of a slow and steady growth strategy paying off.
While some networks experience swings in their user base or show a boom and bust growth pattern, LinkedIn has grown every single year since it was launched. Surprisingly, that growth is still clocking in at impressive rates. In 2019, for example, LinkedIn reported a 24% increase in sessions on their platform.
3. Will Facebook ever lose its top spot?
Never say never, but not anytime soon. Since 2008, Facebook has been far and away the most popular social network on the planet. If you include Facebook’s bundled services, over 2 billion people use their network each day. The company has used acquisitions and aggressive feature implementation to keep the company at the forefront of the battle for attention. Facebook itself is under a lot of scrutiny due to growing privacy concerns, but Instagram and WhatsApp are more popular than ever.
4. What Happened to Snapchat?
In 2016, Snapchat had thoroughly conquered the Gen Z demographic and was on a trajectory to becoming one of the top social networks. Facebook, sensing their position being challenged by this upstart company, took the bold step of cloning Snapchat’s features and integrating them into Instagram (even lifting the name “stories” in the process). The move paid off for Facebook and the video above shows Instagram’s user base taking off in 2016, fueled by these new features.
Even though Facebook took some of the wind out of Snapchat’s sails, the company never stopped growing. Earlier this year, Snapchat announced modest growth as its base of daily active users rose to 190 million. For advertisers looking to reach the 18-35 age demographic, Snapchat could still be a compelling option.
5. Why is TikTok so popular now?
The simple answer is that short-form video is extremely popular right now, and TikTok has features that make sharing fun. The average user of TikTok (and its Chinese counterpart, DouYin) spends a staggering 52 minutes per day on the app.
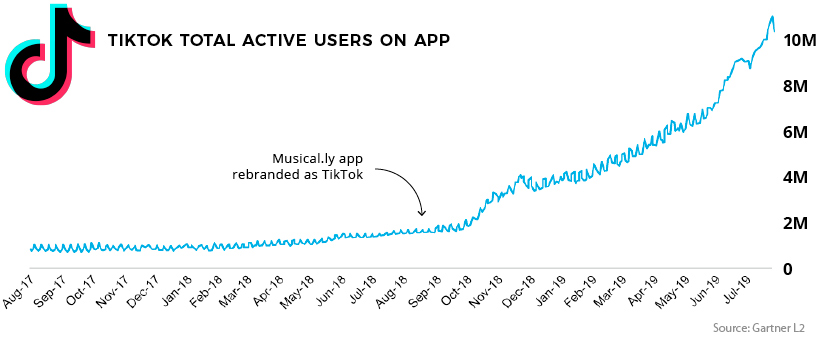
Also propelling its growth is the company’s massive marketing budget. TikTok spent $1 billon last year on advertising in the U.S., and is currently burning through around $3 million per day to get people onto their platform. One looming question for the China-based company is not whether Facebook will co-opt their features, but when.


Technology
Ranked: Semiconductor Companies by Industry Revenue Share
Nvidia is coming for Intel’s crown. Samsung is losing ground. AI is transforming the space. We break down revenue for semiconductor companies.


Semiconductor Companies by Industry Revenue Share
This was originally posted on our Voronoi app. Download the app for free on Apple or Android and discover incredible data-driven charts from a variety of trusted sources.
Did you know that some computer chips are now retailing for the price of a new BMW?
As computers invade nearly every sphere of life, so too have the chips that power them, raising the revenues of the businesses dedicated to designing them.
But how did various chipmakers measure against each other last year?
We rank the biggest semiconductor companies by their percentage share of the industry’s revenues in 2023, using data from Omdia research.
Which Chip Company Made the Most Money in 2023?
Market leader and industry-defining veteran Intel still holds the crown for the most revenue in the sector, crossing $50 billion in 2023, or 10% of the broader industry’s topline.
All is not well at Intel, however, with the company’s stock price down over 20% year-to-date after it revealed billion-dollar losses in its foundry business.
| Rank | Company | 2023 Revenue | % of Industry Revenue |
|---|---|---|---|
| 1 | Intel | $51B | 9.4% |
| 2 | NVIDIA | $49B | 9.0% |
| 3 | Samsung Electronics | $44B | 8.1% |
| 4 | Qualcomm | $31B | 5.7% |
| 5 | Broadcom | $28B | 5.2% |
| 6 | SK Hynix | $24B | 4.4% |
| 7 | AMD | $22B | 4.1% |
| 8 | Apple | $19B | 3.4% |
| 9 | Infineon Tech | $17B | 3.2% |
| 10 | STMicroelectronics | $17B | 3.2% |
| 11 | Texas Instruments | $17B | 3.1% |
| 12 | Micron Technology | $16B | 2.9% |
| 13 | MediaTek | $14B | 2.6% |
| 14 | NXP | $13B | 2.4% |
| 15 | Analog Devices | $12B | 2.2% |
| 16 | Renesas Electronics Corporation | $11B | 1.9% |
| 17 | Sony Semiconductor Solutions Corporation | $10B | 1.9% |
| 18 | Microchip Technology | $8B | 1.5% |
| 19 | Onsemi | $8B | 1.4% |
| 20 | KIOXIA Corporation | $7B | 1.3% |
| N/A | Others | $126B | 23.2% |
| N/A | Total | $545B | 100% |
Note: Figures are rounded. Totals and percentages may not sum to 100.
Meanwhile, Nvidia is very close to overtaking Intel, after declaring $49 billion of topline revenue for 2023. This is more than double its 2022 revenue ($21 billion), increasing its share of industry revenues to 9%.
Nvidia’s meteoric rise has gotten a huge thumbs-up from investors. It became a trillion dollar stock last year, and broke the single-day gain record for market capitalization this year.
Other chipmakers haven’t been as successful. Out of the top 20 semiconductor companies by revenue, 12 did not match their 2022 revenues, including big names like Intel, Samsung, and AMD.
The Many Different Types of Chipmakers
All of these companies may belong to the same industry, but they don’t focus on the same niche.
According to Investopedia, there are four major types of chips, depending on their functionality: microprocessors, memory chips, standard chips, and complex systems on a chip.
Nvidia’s core business was once GPUs for computers (graphics processing units), but in recent years this has drastically shifted towards microprocessors for analytics and AI.
These specialized chips seem to be where the majority of growth is occurring within the sector. For example, companies that are largely in the memory segment—Samsung, SK Hynix, and Micron Technology—saw peak revenues in the mid-2010s.

-

 Business2 weeks ago
America’s Top Companies by Revenue (1994 vs. 2023)
-

 Environment1 week ago
Ranked: Top Countries by Total Forest Loss Since 2001
-

 Markets1 week ago
Visualizing America’s Shortage of Affordable Homes
-

 Maps2 weeks ago
Mapped: Average Wages Across Europe
-

 Mining2 weeks ago
Charted: The Value Gap Between the Gold Price and Gold Miners
-

 Demographics2 weeks ago
Visualizing the Size of the Global Senior Population
-

 Misc2 weeks ago
Tesla Is Once Again the World’s Best-Selling EV Company
-

 Technology2 weeks ago
Ranked: The Most Popular Smartphone Brands in the U.S.