Wealth
The Richest People in the World in 2022


The Richest People in the World in 2022
Today, the 10 richest people in the world control $1.3 trillion in wealth.
This scale of wealth is equal to approximately 1.3% of the world economy, Amazon’s entire market cap, or spending $1 million a day over 3,000 years. In fact, it’s almost double the amount seen two years ago ($663 billion).
As billionaire wealth accumulates at a remarkable speed, we feature a snapshot of the world’s richest in 2022, based on data from the Forbes Real-Time Billionaires List.
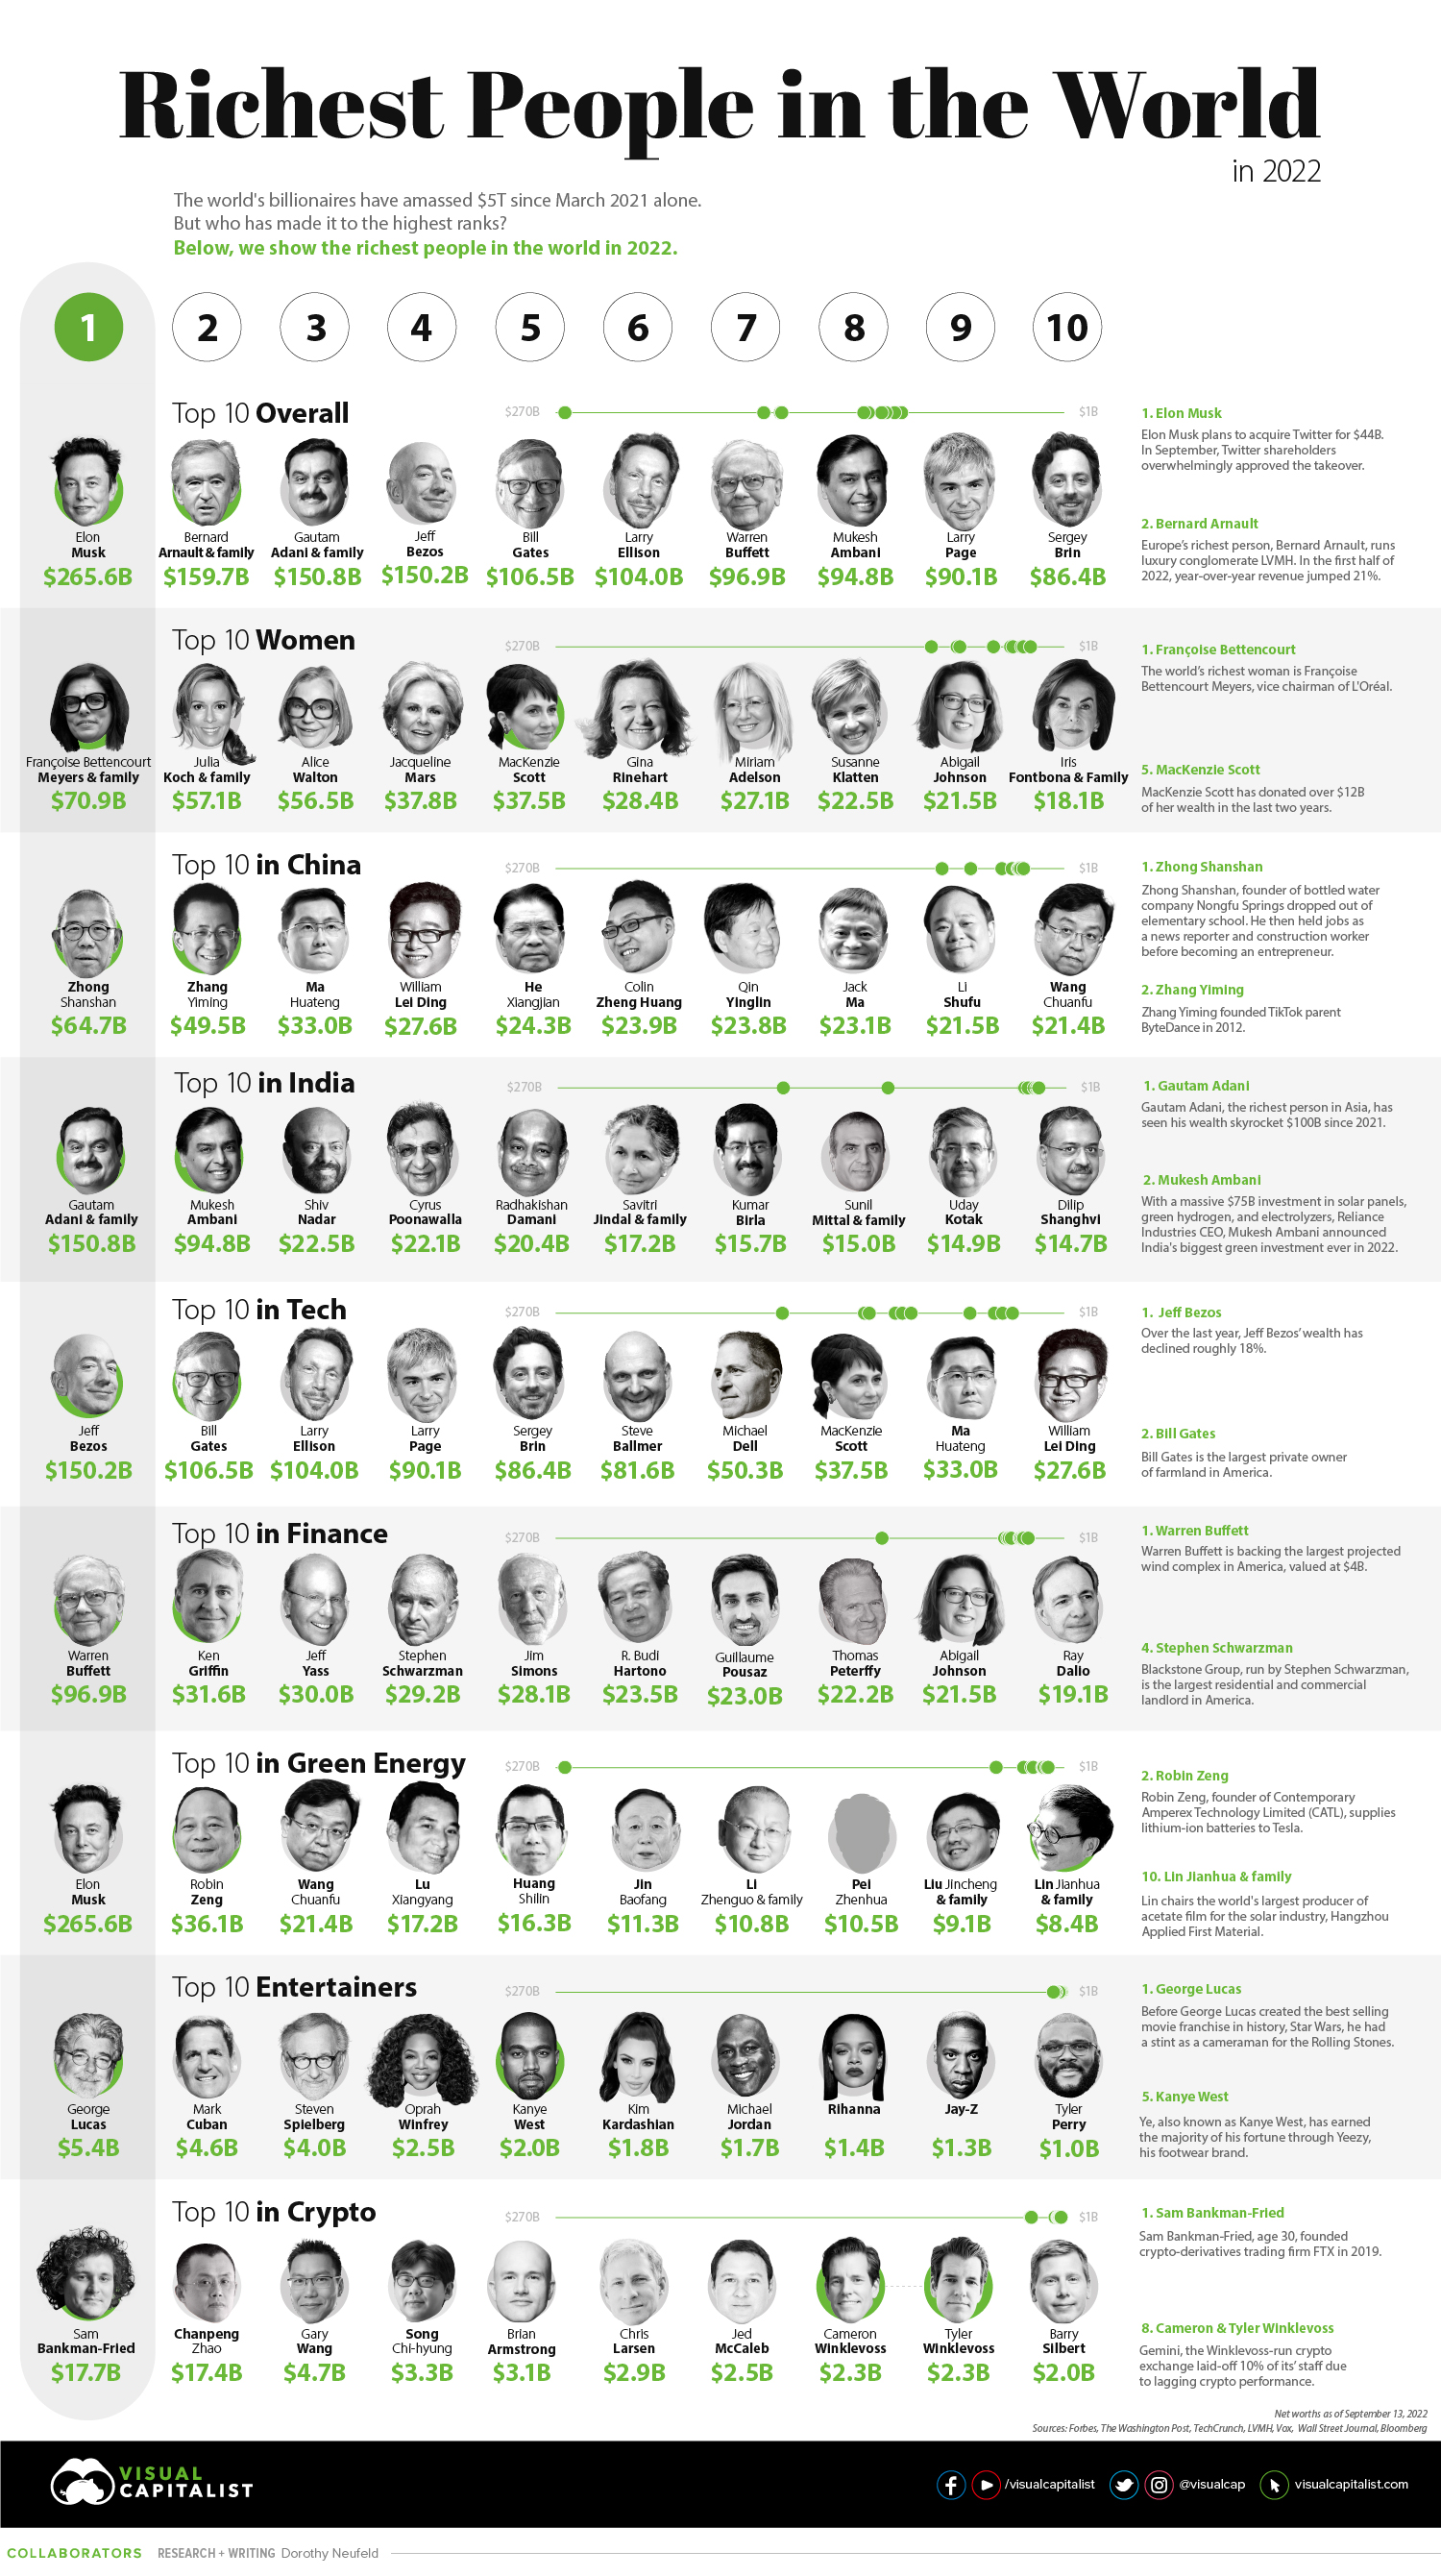
Top 10 Richest People in the World
Elon Musk, with a fortune of $266 billion, is the richest person on the planet.
Despite supply chain bottlenecks, Tesla deliveries have increased 27% since the second quarter of 2021. Musk, who is also CEO and chief engineer of SpaceX, plans to send the largest rocket ever built into orbit in 2022. It spans 119 meters tall.
Here are the richest people in the world, based on data as of September 13, 2022:
| Rank | Name | Source | Net Worth (Sep 2022) | Net Worth (Mar 2021) | Change 2021-2022 |
|---|---|---|---|---|---|
| 1 | Elon Musk | Tesla, SpaceX | $266B | $151B | $115B |
| 2 | Bernard Arnault & family | LVMH | $160B | $150B | $10B |
| 3 | Gautam Adani & family | Infrastructure, Commodities | $151B | $51B | $100B |
| 4 | Jeff Bezos | Amazon | $150B | $177B | -$27B |
| 5 | Bill Gates | Microsoft | $107B | $124B | -$17B |
| 6 | Larry Ellison | Oracle | $104B | $93B | $11B |
| 7 | Warren Buffett | Berkshire Hathaway | $97B | $96B | $1B |
| 8 | Mukesh Ambani | Diversified | $95B | $85B | $10B |
| 9 | Larry Page | $90B | $92B | -$2B | |
| 10 | Sergey Brin | $86B | $89B | -$3B |
With a net worth of $150 billion, Jeff Bezos sits in fourth place. Since last March, Amazon shares have fallen over 20% in light of inflationary price pressures and lagging retail performance.
Most notably, Mark Zuckerberg, CEO of Meta (formerly Facebook) fell off the top 10 for the first time since 2016. Meta shares plunged after reporting the first-ever drop in global daily active users since 2004.
Growth Rates of the Top 10 Overall
Among the 10 richest people in the world, here’s who saw their wealth rise the fastest:
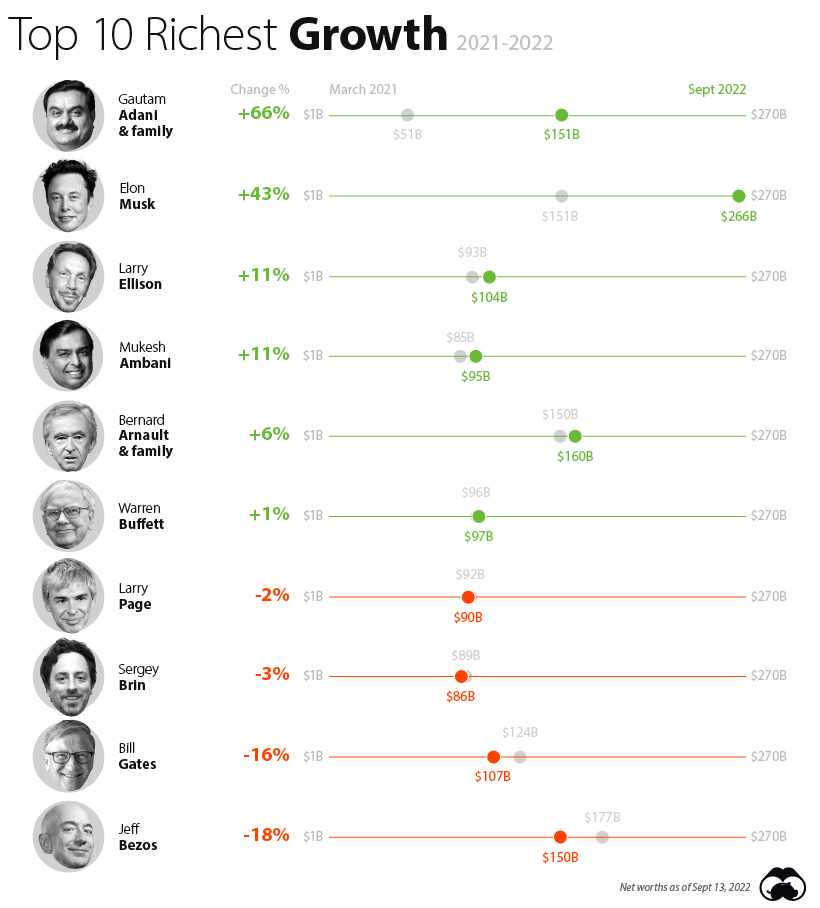
Gautam Adani saw his fortune rise more than any other in this top 10 list. Adani heads one of the three largest industrial conglomerates in India. In the coming years, Adani plans to invest $70 billion in the renewable energy sector.
Like Adani, Musk saw his wealth rise among the fastest, even as Tesla shares have declined over 30% since their peak in November.
Crypto Billionaires in 2022
Even amid the crypto winter, at least ten people worldwide have seen their wealth climb into the billions thanks to the stratospheric rise of cryptocurrencies.
Sam Bankman-Fried, founder of the FTX crypto derivatives exchange, is at the top, with a jaw-dropping $18 billion net worth. Bankman-Fried launched the exchange in 2019 when he was 27.
FTX now has one million users and a $32 billion valuation.
| Rank | Name | Net Worth | Age (as of Sep 2022) |
|---|---|---|---|
| 1 | Sam Bankman-Fried | $18B | 30 |
| 2 | Changpeng Zhao | $17B | 45 |
| 3 | Gary Wang | $5B | 29 |
| 4 | Song Chi-hyung | $3B | 43 |
| 5 | Brian Armstrong | $3B | 39 |
| 5 | Chris Larsen | $3B | 62 |
| 6 | Jed McCaleb | $3B | 47 |
| 7 | Cameron Winklevoss | $2B | 41 |
| 8 | Tyler Winklevoss | $2B | 41 |
| 9 | Barry Silbert | $2B | 46 |
Following Bankman-Fried is Changpeng Zhao, the co-founder of cryptocurrency exchange Binance. It is the largest exchange globally.
Also on the list are co-founders of Gemini cryptocurrency exchange Cameron and Tyler Winklevoss, each with a net worth of over $2 billion. Like their rival, Mark Zuckerberg, they have their sights on building a metaverse.
Larger Shifts
Will billionaire wealth continue to accumulate at record rates? As the invasion of Ukraine presses on, it will likely have broader structural outcomes.
Some argue that war is a great leveler, a force that has reduced wealth inequality, as seen in the aftermath of WWII. Others suggest that it increases wealth divergence, especially when the war is financed by public debt. Often, costs have become inflated due to war, putting pressure on low and middle-income households.
Whether or not the war will have lasting effects on wealth distribution is an open question, however, if the pandemic serves as any precedent, the effects will be far from predictable.


Wealth
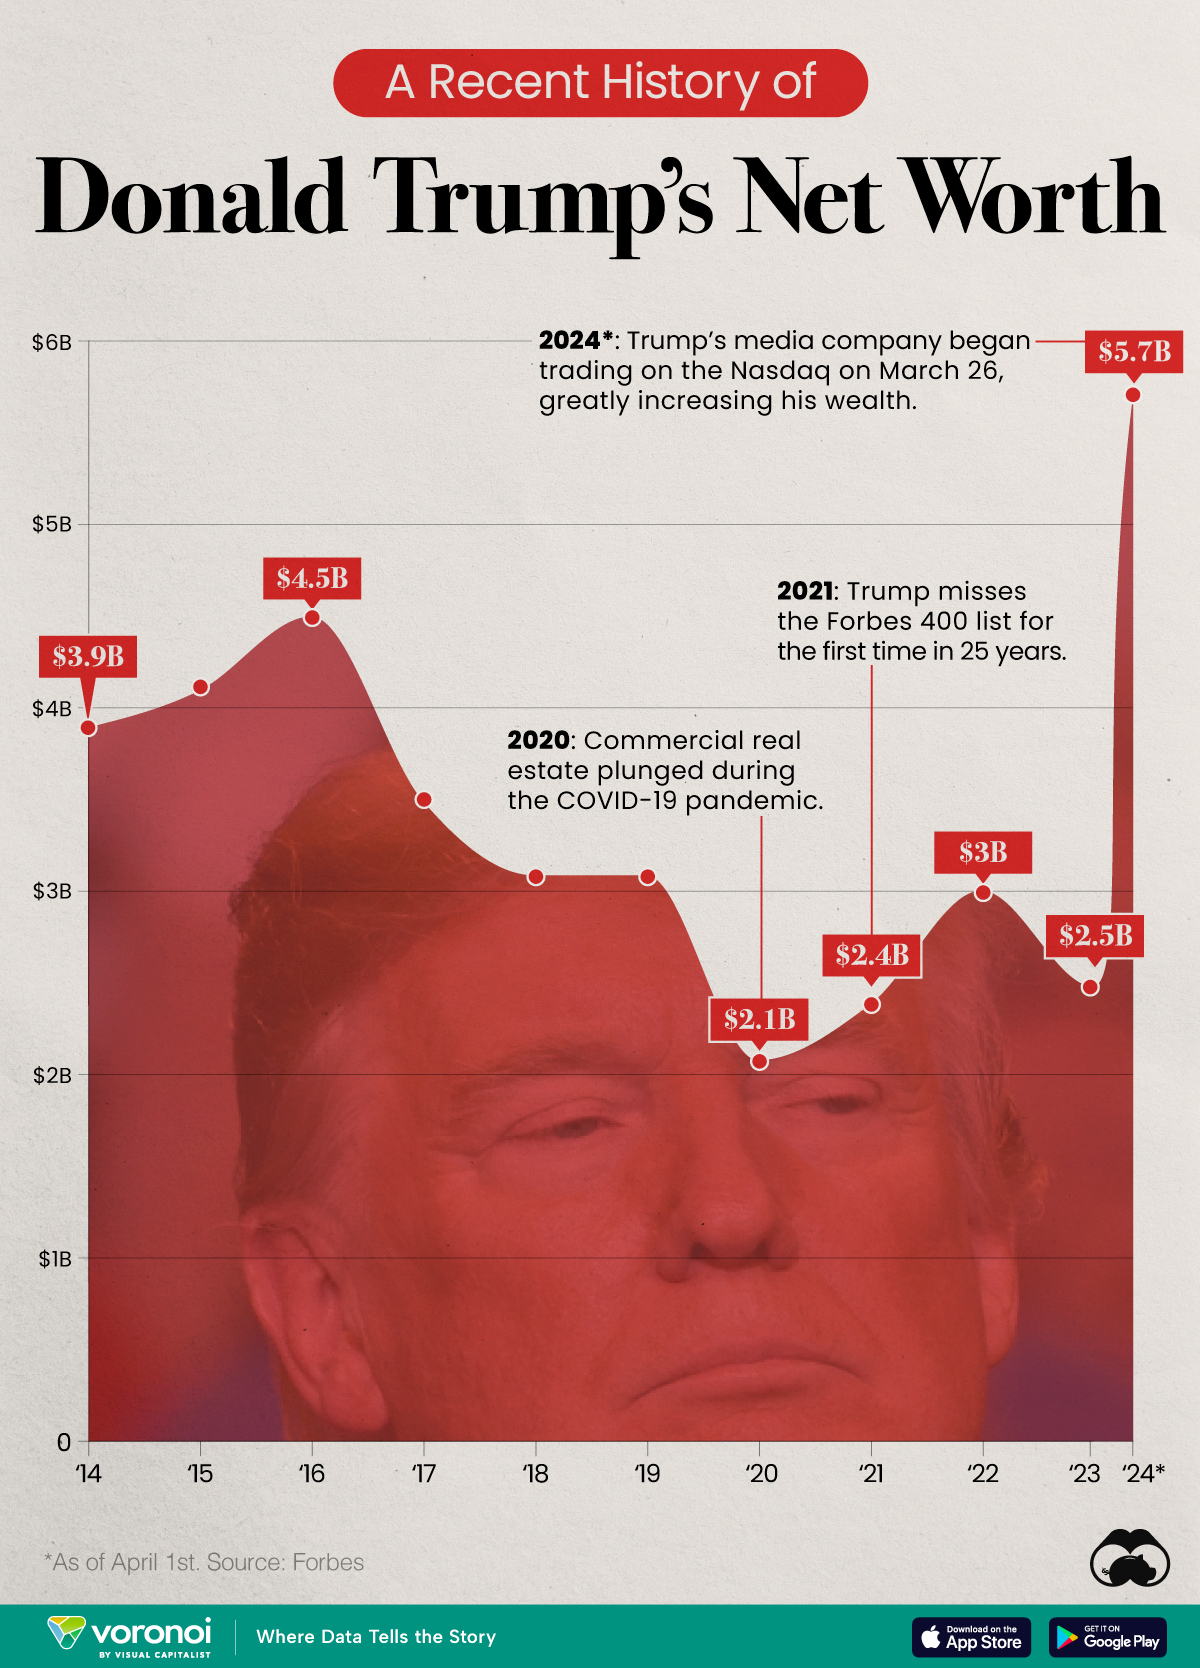
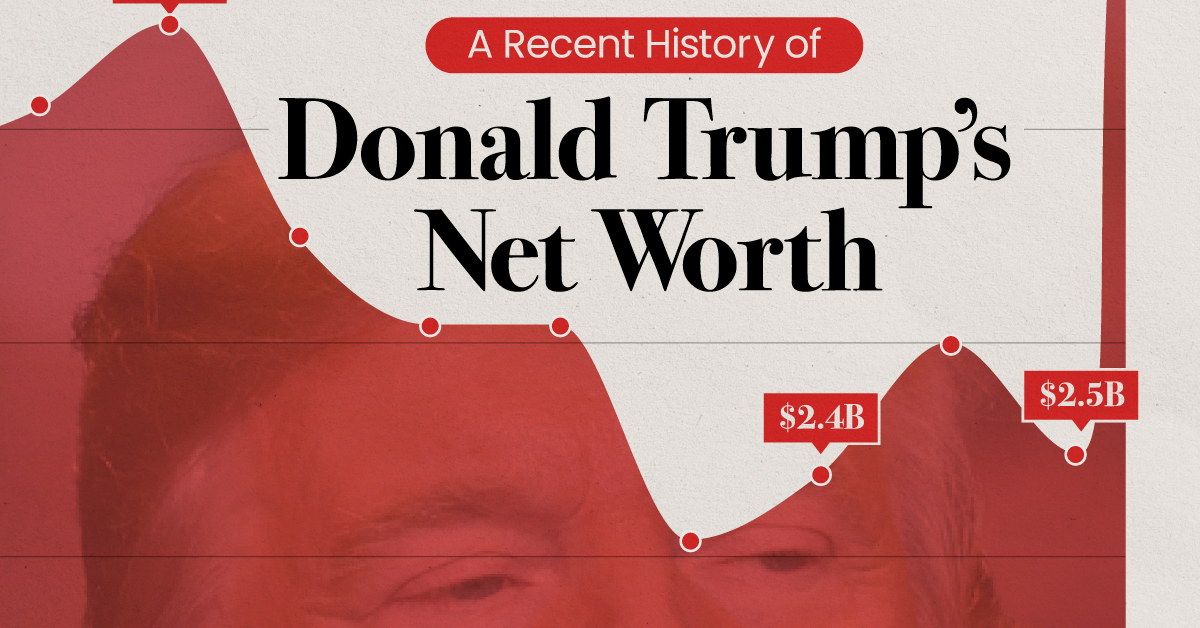
Charted: Donald Trump’s Net Worth (2014-2024)
See how the Nasdaq debut of Trump Media & Technology Group has influenced Trump’s net worth, according to Forbes estimates.
Charted: Donald Trump’s Net Worth (2014-2024)
This was originally posted on our Voronoi app. Download the app for free on iOS or Android and discover incredible data-driven charts from a variety of trusted sources.
On March 26, 2024, Trump Media & Technology Group (Ticker: DJT) debuted on the Nasdaq exchange, climbing over 30% in its first two days of trading. This gave the company a valuation of $9.4 billion, greatly increasing Donald Trump’s net worth.
To put this increase into perspective, we’ve visualized the past 10 years of Trump’s wealth as measured by Forbes.
Trump’s Net Worth Jumps After Nasdaq Listing
The data we used to create this graphic can be found in the table below. As of April 1, 2024, Trump’s net worth was measured at $5.7 billion. Note that Forbes updates this value regularly.
| Year | Net Worth ($B) |
|---|---|
| 2014 | 3.9 |
| 2015 | 4.1 |
| 2016 | 4.5 |
| 2017 | 3.5 |
| 2018 | 3.1 |
| 2019 | 3.1 |
| 2020 | 2.1 |
| 2021 | 2.4 |
| 2022 | 3.0 |
| 2023 | 2.5 |
| 2024 (As of April 1) | 5.7 |
It’s safe to say that going forward, Trump’s net worth will be largely influenced by the value of his stake in Trump Media & Technology Group (TMTG). SEC filings have revealed that the former president has a stake of at least 58.1% in the company.
What is Trump Media & Technology Group?
TMTG is a media company founded in 2021 by Trump, debuting on the Nasdaq as a public company after merging with Digital World Acquisition Corp, a special-purpose acquisition company (SPAC).
Also known as “blank check companies”, SPACs are shell corporations listed on a stock exchange that acquire a private company with the purpose of making it public (without going through an IPO).
TMTG released its X (formerly Twitter) competitor, Truth Social, in Feb 2022. According to estimates from SimilarWeb, the platform had around 5 million monthly users as of Feb 2024.
DJT Slips After Reporting Weak Financials
After its hot debut on the Nasdaq, DJT shares have stumbled, falling by more than 20% on April 1. This is due to recent disclosures which revealed that the company lost over $58 million in 2023.
Revenue in 2023 was $4.1 million, which is higher than the $1.5 million generated in 2022.
Learn More About the World’s Wealthiest Individuals
If you found this post interesting, check out our annual list of the world’s richest people, or this graphic ranking the world’s richest monarchs.

-

 Markets2 weeks ago
Visualizing America’s Shortage of Affordable Homes
-

 Technology1 week ago
Ranked: Semiconductor Companies by Industry Revenue Share
-

 Money1 week ago
Which States Have the Highest Minimum Wage in America?
-

 Real Estate1 week ago
Ranked: The Most Valuable Housing Markets in America
-

 Business2 weeks ago
Charted: Big Four Market Share by S&P 500 Audits
-

 AI2 weeks ago
The Stock Performance of U.S. Chipmakers So Far in 2024
-

 Misc2 weeks ago
Almost Every EV Stock is Down After Q1 2024
-

 Money2 weeks ago
Where Does One U.S. Tax Dollar Go?