Mining
Re-Awakening of the Golden Triangle
The Re-Awakening of the Golden Triangle
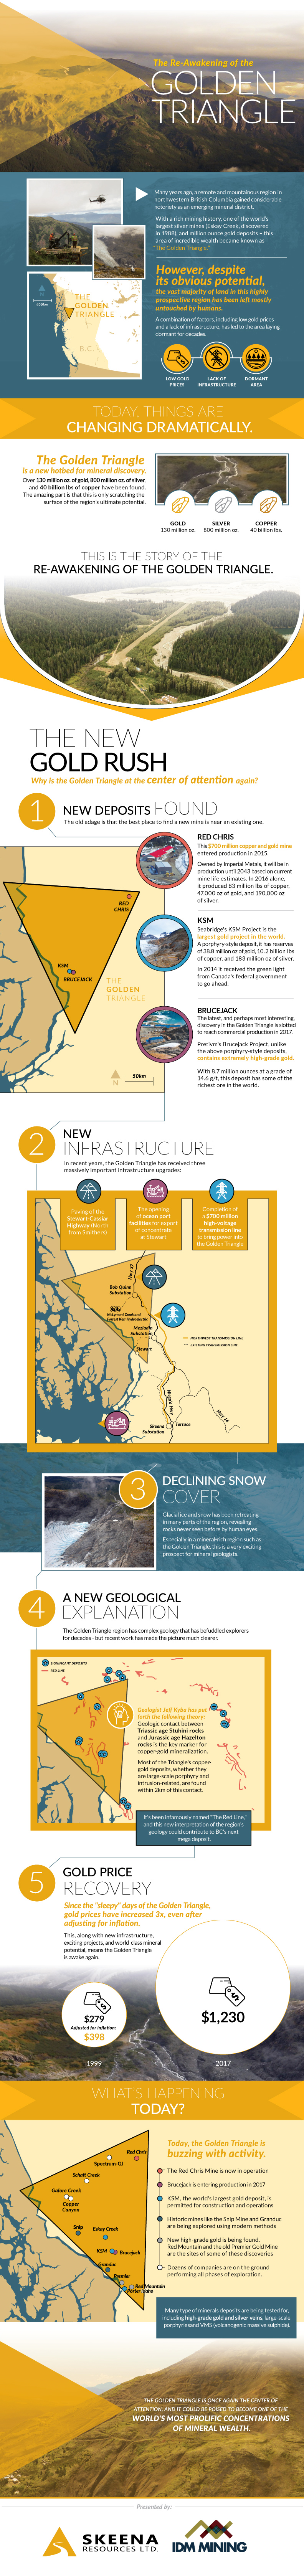
Many years ago, a remote and mountainous region in northwestern British Columbia gained considerable notoriety as an emerging mineral district. With a rich mining history, one of the world’s largest silver mines (Eskay Creek, discovered in 1988), and million ounce gold deposits – this area of incredible wealth became known as “The Golden Triangle”.
However, despite its obvious potential, the vast majority of land in this highly prospective region has been left mostly untouched by humans. A combination of factors, including low gold prices and a lack of infrastructure, has led to the area laying dormant for decades.
Today, things are changing dramatically. The Golden Triangle is a new hotbed for mineral discovery, and over 130 million ounces of gold, 800 million ounces of silver, and 40 billion lbs of copper have been found. The amazing part is that this is only scratching the surface of the region’s ultimate potential.
Skeena Resources and IDM Mining have generously helped us to put together the story on the re-awakening of the famed Golden Triangle.
The New Gold Rush
Why is the Golden Triangle at the center of attention again? There are five main reasons:
1. New Deposits Found
The old adage is that the best place to find a new mine is near an existing one. Here are three major deposits in the Golden Triangle that have geologists and financiers buzzing:
KSM
Seabridge’s KSM Project is the largest gold project in the world. It recently received the green light from Canada’s federal government to go ahead in 2014.
A porphyry-style deposit, it has reserves of 38.8 million oz of gold, 10.2 billion lbs of copper, and 183 million oz of silver.
Red Chris
This $700 million copper and gold mine entered production in 2015.
Owned by Imperial Metals, it will be in production until 2043 based on current mine life estimates. In 2016 alone, it produced 83 million lbs of copper, 47,000 oz of gold, and 190,000 oz of silver.
Valley of the Kings
The latest, and perhaps most interesting, discovery in the Golden Triangle is slotted to reach commercial production in 2017.
The Valley of the Kings, unlike the above porphyry-style deposits, contains extremely high-grade gold. With 8.1 million ounces at a grade of 16.1 g/t, this deposit has some of the richest ore in the world.
2. New Infrastructure
In recent years, the Golden Triangle has received three massively important infrastructure upgrades:
- Paving of the Stewart-Cassiar Highway (North from Smithers)
- The opening of ocean port facilities for export of concentrate at Stewart
- Completion of a $700 million high-voltage transmission line to bring power into the Golden Triangle
3. Declining Snow Cover
Glacial ice and snow has been retreating in many parts of the region, revealing rocks never seen before by human eyes. Especially in a mineral-rich region such as the Golden Triangle, this is a very exciting prospect for mineral geologists.
4. A New Geological Explanation
The Golden Triangle region has complex geology that has befuddled explorers for decades – but recent work has made the picture much clearer. Geologist Jeff Kyba has put forth the following theory: geologic contact between Triassic age Stuhini rocks and Jurassic age Hazelton rocks is the key marker for copper-gold mineralization.
Most of the Triangle’s copper-gold deposits, whether they are large-scale porphyry and intrusion-related, are found within 2km of this contact. It’s been infamously named “The Red Line”, and this new interpretation of the region’s geology could contribute to BC’s next mega deposit.
5. Gold Price Recovery
Since the “sleepy” days of the Golden Triangle, gold prices have increased 3x, even after adjusting for inflation.
Combined with new infrastructure, exciting projects, and world-class mineral potential, and the Golden Triangle is awake again.
What’s Happening Today?
Today, the Golden Triangle is buzzing with activity.
- The Red Chris Mine is now in operation
- Valley of the Kings is entering production in 2017.
- KSM, the world’s largest gold deposit, is nearing potential construction.
- Historic mines like the Snip Mine and Granduc are being explored using modern methods.
- New high-grade gold is being found. Red Mountain and the old Premier Gold Mine are the sites of some of these discoveries.
- Dozens of companies are on the ground performing all phases of exploration.
Many types of mineral deposits are being tested for, including high-grade gold veins, large-scale porphyries, and VMS (volcanogenic massive sulphide) deposits.
The Golden Triangle is once again the center of the attention, and it could be poised to become one of the world’s most prolific concentrations of mineral wealth.


Lithium
Ranked: The Top 10 EV Battery Manufacturers in 2023
Asia dominates this ranking of the world’s largest EV battery manufacturers in 2023.


The Top 10 EV Battery Manufacturers in 2023
This was originally posted on our Voronoi app. Download the app for free on iOS or Android and discover incredible data-driven charts from a variety of trusted sources.
Despite efforts from the U.S. and EU to secure local domestic supply, all major EV battery manufacturers remain based in Asia.
In this graphic we rank the top 10 EV battery manufacturers by total battery deployment (measured in megawatt-hours) in 2023. The data is from EV Volumes.
Chinese Dominance
Contemporary Amperex Technology Co. Limited (CATL) has swiftly risen in less than a decade to claim the title of the largest global battery group.
The Chinese company now has a 34% share of the market and supplies batteries to a range of made-in-China vehicles, including the Tesla Model Y, SAIC’s MG4/Mulan, and various Li Auto models.
| Company | Country | 2023 Production (megawatt-hour) | Share of Total Production |
|---|---|---|---|
| CATL | 🇨🇳 China | 242,700 | 34% |
| BYD | 🇨🇳 China | 115,917 | 16% |
| LG Energy Solution | 🇰🇷 Korea | 108,487 | 15% |
| Panasonic | 🇯🇵 Japan | 56,560 | 8% |
| SK On | 🇰🇷 Korea | 40,711 | 6% |
| Samsung SDI | 🇰🇷 Korea | 35,703 | 5% |
| CALB | 🇨🇳 China | 23,493 | 3% |
| Farasis Energy | 🇨🇳 China | 16,527 | 2% |
| Envision AESC | 🇨🇳 China | 8,342 | 1% |
| Sunwoda | 🇨🇳 China | 6,979 | 1% |
| Other | - | 56,040 | 8% |
In 2023, BYD surpassed LG Energy Solution to claim second place. This was driven by demand from its own models and growth in third-party deals, including providing batteries for the made-in-Germany Tesla Model Y, Toyota bZ3, Changan UNI-V, Venucia V-Online, as well as several Haval and FAW models.
The top three battery makers (CATL, BYD, LG) collectively account for two-thirds (66%) of total battery deployment.
Once a leader in the EV battery business, Panasonic now holds the fourth position with an 8% market share, down from 9% last year. With its main client, Tesla, now sourcing batteries from multiple suppliers, the Japanese battery maker seems to be losing its competitive edge in the industry.
Overall, the global EV battery market size is projected to grow from $49 billion in 2022 to $98 billion by 2029, according to Fortune Business Insights.

-

 Mining1 week ago
Gold vs. S&P 500: Which Has Grown More Over Five Years?
-

 Markets2 weeks ago
Ranked: The Most Valuable Housing Markets in America
-

 Money2 weeks ago
Which States Have the Highest Minimum Wage in America?
-

 AI2 weeks ago
Ranked: Semiconductor Companies by Industry Revenue Share
-

 Markets2 weeks ago
Ranked: The World’s Top Flight Routes, by Revenue
-

 Countries2 weeks ago
Population Projections: The World’s 6 Largest Countries in 2075
-

 Markets2 weeks ago
The Top 10 States by Real GDP Growth in 2023
-

 Demographics2 weeks ago
The Smallest Gender Wage Gaps in OECD Countries