Markets
RCEP Explained: The World’s Biggest Trading Bloc Will Soon be in Asia-Pacific


RCEP Explained: The World’s Biggest Trading Bloc
Trade and commerce are the lifeblood of the global economy. Naturally, agreements among nations in a certain geographical area help facilitate relationships in ways that are ideally beneficial for everyone involved.
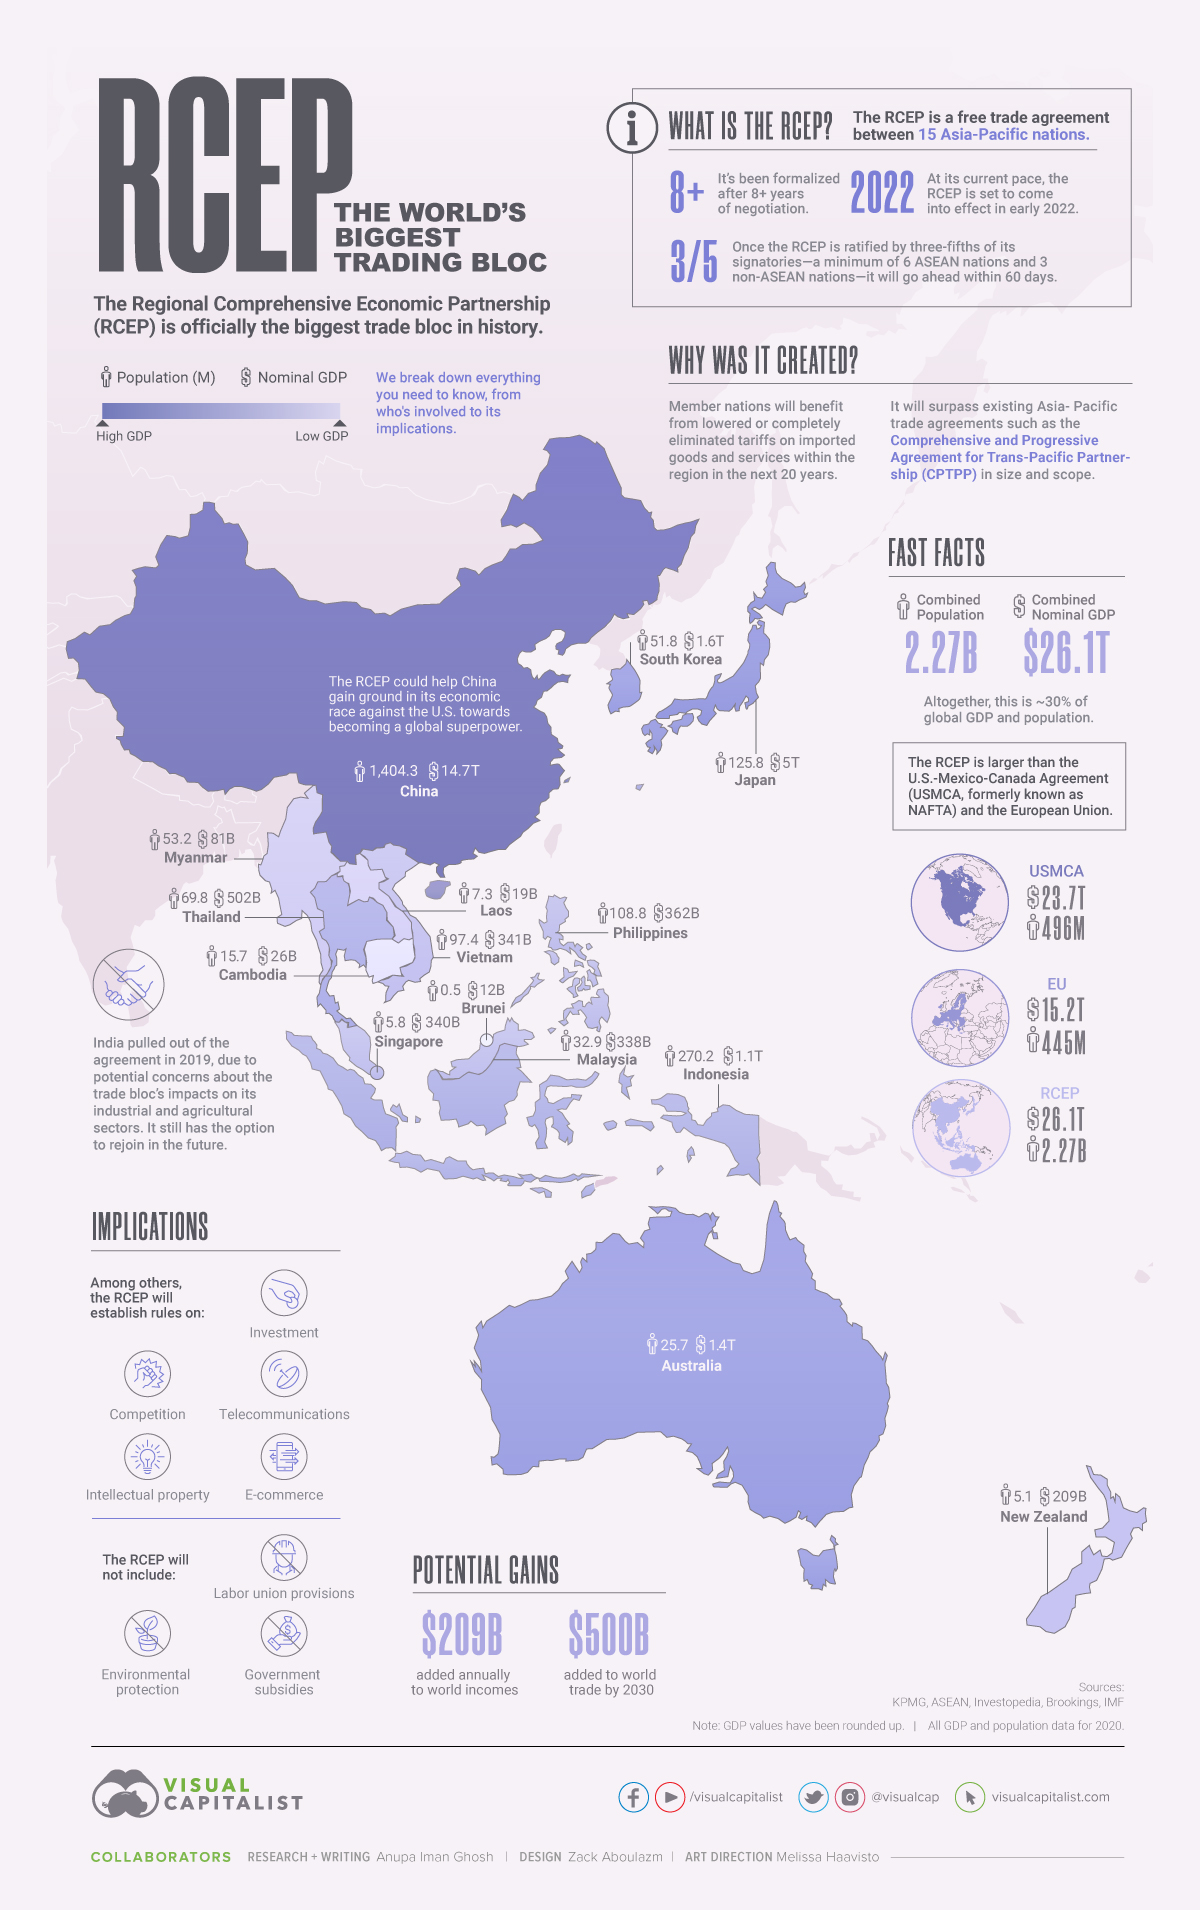
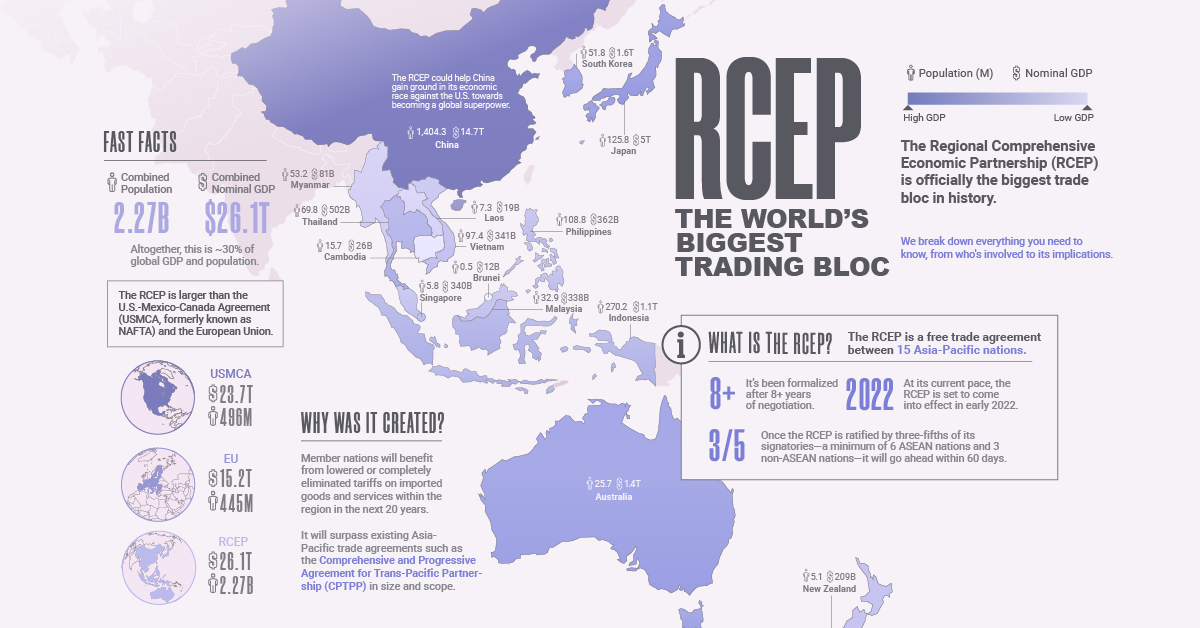
In late 2020, the Regional Comprehensive Economic Partnership (RCEP) was signed, officially creating the biggest trade bloc in history. Here, we break down everything you need to know about it, from who’s involved to its implications.
Who’s in the RCEP, and Why Was it Created?
The RCEP is a free trade agreement between 15 nations in the Asia-Pacific region, and has been formalized after 28 rounds of discussion over eight years.
Member nations who are a part of the RCEP will benefit from lowered or completely eliminated tariffs on imported goods and services within the region in the next 20 years. Here are the countries which have signed on to be member nations:
| Country | Population (M) | Nominal GDP ($B) |
|---|---|---|
| 🇦🇺 Australia | 25.7 | $1,359 |
| 🇧🇳 Brunei | 0.5 | $12 |
| 🇰🇭 Cambodia | 15.7 | $26 |
| 🇨🇳 China | 1404 | $14,723 |
| 🇮🇩 Indonesia | 270.2 | $1,060 |
| 🇯🇵 Japan | 125.8 | $5,049 |
| 🇰🇷 South Korea | 51.8 | $1,631 |
| 🇱🇦 Laos | 7.3 | $19 |
| 🇲🇾 Malaysia | 32.9 | $338 |
| 🇲🇲 Myanmar | 53.2 | $81 |
| 🇳🇿 New Zealand | 5.1 | $209 |
| 🇵🇭 Philippines | 108.8 | $362 |
| 🇸🇬 Singapore | 5.8 | $340 |
| 🇹🇭 Thailand | 69.8 | $502 |
| 🇻🇳 Vietnam | 97.4 | $341 |
| RCEP Total | 2,274.2M | $26,052B |
Source: IMF
But there is still some work to do to bring the trade agreement into full effect.
Signing the agreement, the step taken in late 2020, is simply an initial show of support for the trade agreement, but now it needs to be ratified. That means these nations still have to give their consent to be legally bound to the terms within the RCEP. Once the RCEP is ratified by three-fifths of its signatories—a minimum of six ASEAN nations and three non-ASEAN nations—it will go ahead within 60 days.
So far, it’s been ratified by China, Japan, Thailand, and Singapore as of April 30, 2021. At its current pace, the RCEP is set to come into effect in early 2022 as all member nations have agreed to complete the ratification process within the year.
Interestingly, in the midst of negotiations in 2019, India pulled out of the agreement. This came after potential concerns about the trade bloc’s impacts on its industrial and agricultural sectors that affect the “lives and livelihoods of all Indians”. India retains the option to rejoin the RCEP in the future, if things change.
The Biggest Trading Blocs, Compared
When we say the Regional Comprehensive Economic Partnership is the biggest trade bloc in history, this statement is not hyperbole.
The RCEP will not only surpass existing Asia-Pacific trade agreements such as the Comprehensive and Progressive Agreement for Trans-Pacific Partnership (CPTPP) in size and scope, but also other key regional partnerships in advanced economies.
This includes the European Union and the U.S.-Mexico-Canada Agreement (USMCA, formerly known as NAFTA). How does the trio stack up?
| Nominal GDP, 2020 | Population, 2020 | |
|---|---|---|
| EU | $15.2 trillion | 445 million |
| USMCA | $23.7 trillion | 496 million |
| RCEP | $26.1 trillion | 2.27 billion |
| World | $84.5 trillion | 7.64 billion |
With the combined might of its 15 signatories, the RCEP accounts for approximately 30% of global GDP and population. Interestingly, the total population covered within the RCEP is near or over five times that of the other trade blocs.
Another regional agreement not covered here is the African Continental Free Trade Area (AfCFTA), which is now the largest in terms of participating countries (55 in total), but in the other metrics, the RCEP still emerges superior.
Implications of the Regional Comprehensive Economic Partnership
The potential effects of the RCEP are widespread. Among others, the agreement will establish rules for the region around:
- Investment
- Competition
- E-commerce
- Intellectual property
- Telecommunications
However, there are some key exclusions that have raised critics’ eyebrows. These are:
- Labor union provisions
- Environmental protection
- Government subsidies
The RCEP could also help China gain even more ground in its economic race against the U.S. towards becoming a global superpower.
Last, but most importantly, Brookings estimates that the potential gains from the RCEP are in the high billions: $209 billion could be added annually to world incomes, and $500 billion may be added to world trade by 2030.


Markets
U.S. Debt Interest Payments Reach $1 Trillion
U.S. debt interest payments have surged past the $1 trillion dollar mark, amid high interest rates and an ever-expanding debt burden.


U.S. Debt Interest Payments Reach $1 Trillion
This was originally posted on our Voronoi app. Download the app for free on iOS or Android and discover incredible data-driven charts from a variety of trusted sources.
The cost of paying for America’s national debt crossed the $1 trillion dollar mark in 2023, driven by high interest rates and a record $34 trillion mountain of debt.
Over the last decade, U.S. debt interest payments have more than doubled amid vast government spending during the pandemic crisis. As debt payments continue to soar, the Congressional Budget Office (CBO) reported that debt servicing costs surpassed defense spending for the first time ever this year.
This graphic shows the sharp rise in U.S. debt payments, based on data from the Federal Reserve.
A $1 Trillion Interest Bill, and Growing
Below, we show how U.S. debt interest payments have risen at a faster pace than at another time in modern history:
| Date | Interest Payments | U.S. National Debt |
|---|---|---|
| 2023 | $1.0T | $34.0T |
| 2022 | $830B | $31.4T |
| 2021 | $612B | $29.6T |
| 2020 | $518B | $27.7T |
| 2019 | $564B | $23.2T |
| 2018 | $571B | $22.0T |
| 2017 | $493B | $20.5T |
| 2016 | $460B | $20.0T |
| 2015 | $435B | $18.9T |
| 2014 | $442B | $18.1T |
| 2013 | $425B | $17.2T |
| 2012 | $417B | $16.4T |
| 2011 | $433B | $15.2T |
| 2010 | $400B | $14.0T |
| 2009 | $354B | $12.3T |
| 2008 | $380B | $10.7T |
| 2007 | $414B | $9.2T |
| 2006 | $387B | $8.7T |
| 2005 | $355B | $8.2T |
| 2004 | $318B | $7.6T |
| 2003 | $294B | $7.0T |
| 2002 | $298B | $6.4T |
| 2001 | $318B | $5.9T |
| 2000 | $353B | $5.7T |
| 1999 | $353B | $5.8T |
| 1998 | $360B | $5.6T |
| 1997 | $368B | $5.5T |
| 1996 | $362B | $5.3T |
| 1995 | $357B | $5.0T |
| 1994 | $334B | $4.8T |
| 1993 | $311B | $4.5T |
| 1992 | $306B | $4.2T |
| 1991 | $308B | $3.8T |
| 1990 | $298B | $3.4T |
| 1989 | $275B | $3.0T |
| 1988 | $254B | $2.7T |
| 1987 | $240B | $2.4T |
| 1986 | $225B | $2.2T |
| 1985 | $219B | $1.9T |
| 1984 | $205B | $1.7T |
| 1983 | $176B | $1.4T |
| 1982 | $157B | $1.2T |
| 1981 | $142B | $1.0T |
| 1980 | $113B | $930.2B |
| 1979 | $96B | $845.1B |
| 1978 | $84B | $789.2B |
| 1977 | $69B | $718.9B |
| 1976 | $61B | $653.5B |
| 1975 | $55B | $576.6B |
| 1974 | $50B | $492.7B |
| 1973 | $45B | $469.1B |
| 1972 | $39B | $448.5B |
| 1971 | $36B | $424.1B |
| 1970 | $35B | $389.2B |
| 1969 | $30B | $368.2B |
| 1968 | $25B | $358.0B |
| 1967 | $23B | $344.7B |
| 1966 | $21B | $329.3B |
Interest payments represent seasonally adjusted annual rate at the end of Q4.
At current rates, the U.S. national debt is growing by a remarkable $1 trillion about every 100 days, equal to roughly $3.6 trillion per year.
As the national debt has ballooned, debt payments even exceeded Medicaid outlays in 2023—one of the government’s largest expenditures. On average, the U.S. spent more than $2 billion per day on interest costs last year. Going further, the U.S. government is projected to spend a historic $12.4 trillion on interest payments over the next decade, averaging about $37,100 per American.
Exacerbating matters is that the U.S. is running a steep deficit, which stood at $1.1 trillion for the first six months of fiscal 2024. This has accelerated due to the 43% increase in debt servicing costs along with a $31 billion dollar increase in defense spending from a year earlier. Additionally, a $30 billion increase in funding for the Federal Deposit Insurance Corporation in light of the regional banking crisis last year was a major contributor to the deficit increase.
Overall, the CBO forecasts that roughly 75% of the federal deficit’s increase will be due to interest costs by 2034.

-

 Maps2 weeks ago
Mapped: Average Wages Across Europe
-

 Money1 week ago
Which States Have the Highest Minimum Wage in America?
-

 Real Estate1 week ago
Ranked: The Most Valuable Housing Markets in America
-

 Markets1 week ago
Charted: Big Four Market Share by S&P 500 Audits
-

 AI1 week ago
The Stock Performance of U.S. Chipmakers So Far in 2024
-

 Automotive2 weeks ago
Almost Every EV Stock is Down After Q1 2024
-

 Money2 weeks ago
Where Does One U.S. Tax Dollar Go?
-

 Green2 weeks ago
Ranked: Top Countries by Total Forest Loss Since 2001