Mining
Rare Earth Elements: Where in the World Are They?
![]() Subscribe to the Elements free mailing list for more like this
Subscribe to the Elements free mailing list for more like this


Rare Earths Elements: Where in the World Are They?
This was originally posted on Elements. Sign up to the free mailing list to get beautiful visualizations on natural resource megatrends in your email every week.
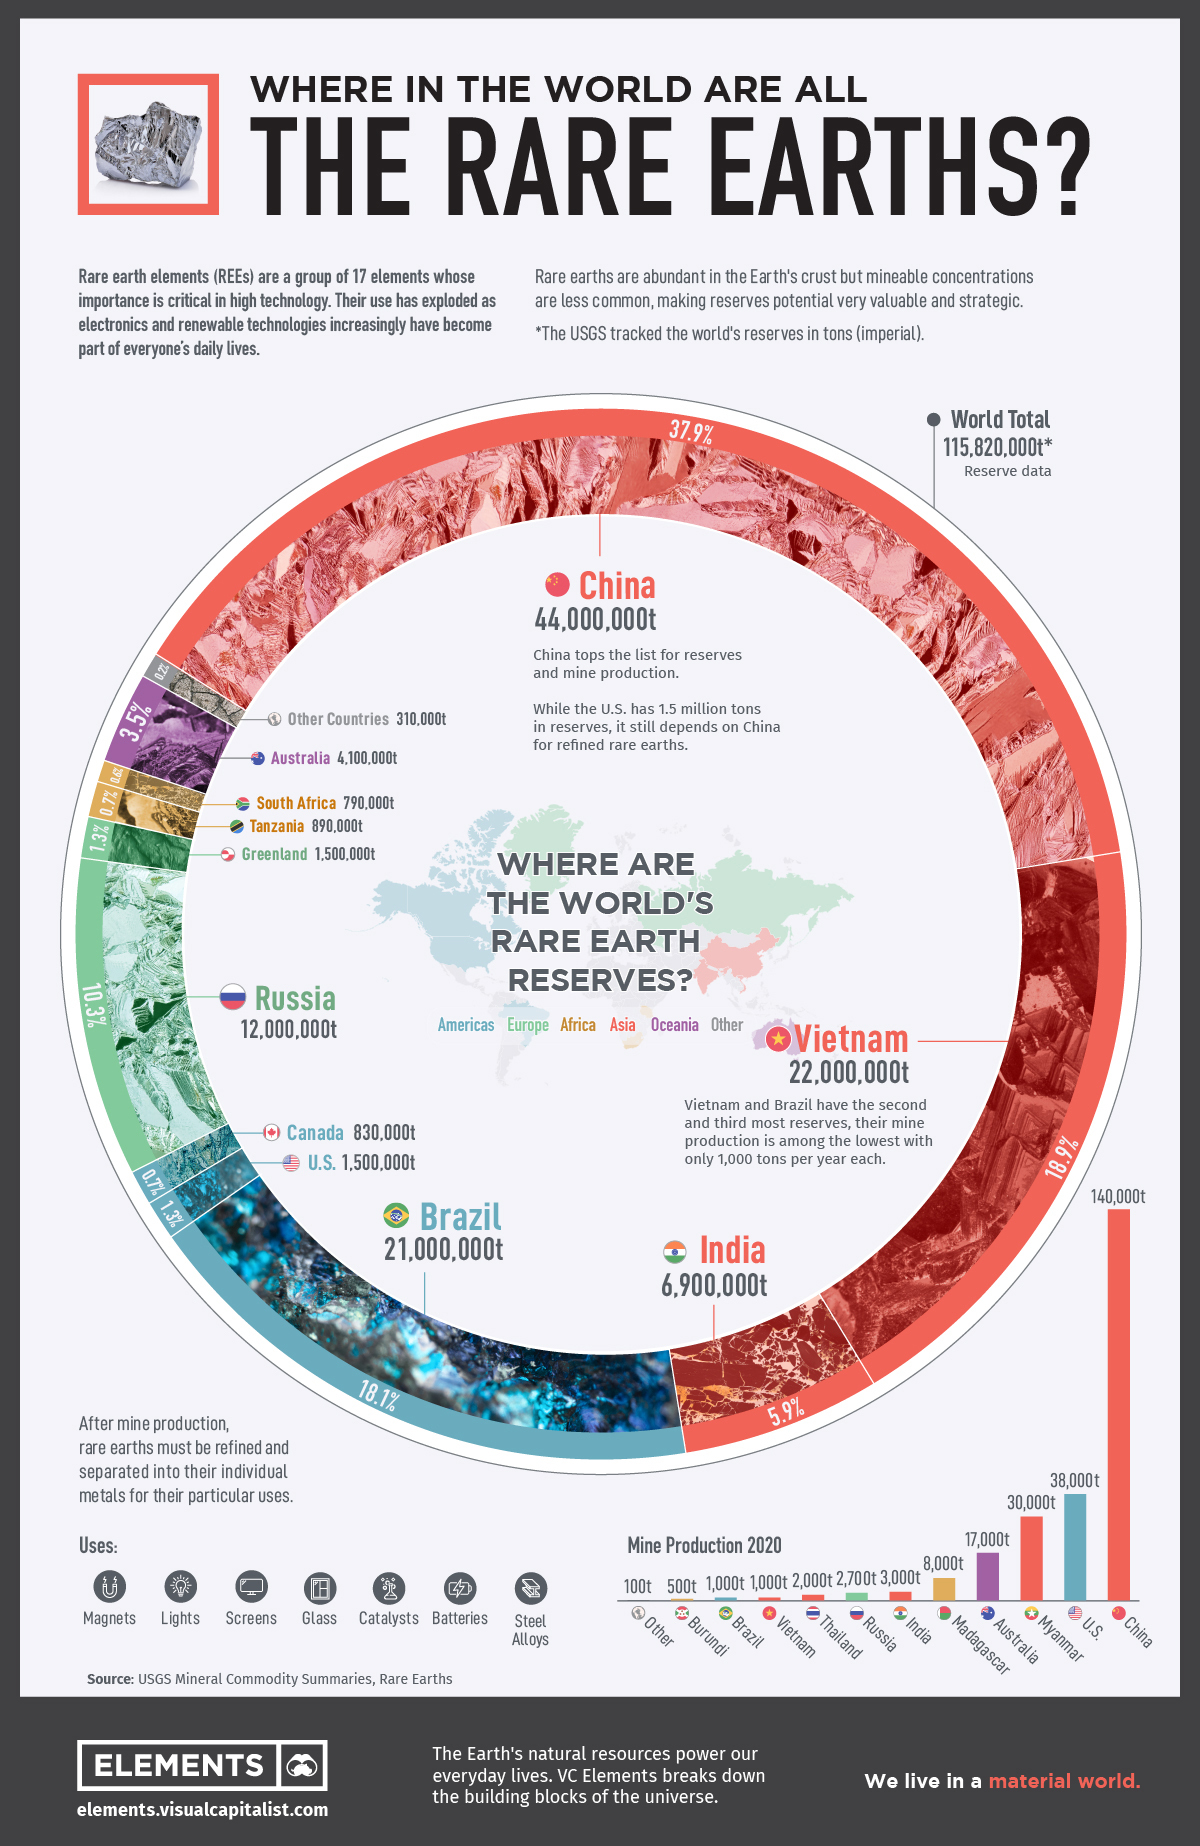
Rare earth elements are a group of metals that are critical ingredients for a greener economy, and the location of the reserves for mining are increasingly important and valuable.
This infographic features data from the United States Geological Society (USGS) which reveals the countries with the largest known reserves of rare earth elements (REEs).
What are Rare Earth Metals?
REEs, also called rare earth metals or rare earth oxides, or lanthanides, are a set of 17 silvery-white soft heavy metals.
The 17 rare earth elements are: lanthanum (La), cerium (Ce), praseodymium (Pr), neodymium (Nd), promethium (Pm), samarium (Sm), europium (Eu), gadolinium (Gd), terbium (Tb), dysprosium (Dy), holmium (Ho), erbium (Er), thulium (Tm), ytterbium (Yb), lutetium (Lu), scandium (Sc), and yttrium (Y).
Scandium and yttrium are not part of the lanthanide family, but end users include them because they occur in the same mineral deposits as the lanthanides and have similar chemical properties.
The term “rare earth” is a misnomer as rare earth metals are actually abundant in the Earth’s crust. However, they are rarely found in large, concentrated deposits on their own, but rather among other elements instead.
Rare Earth Elements, How Do They Work?
Most rare earth elements find their uses as catalysts and magnets in traditional and low-carbon technologies. Other important uses of rare earth elements are in the production of special metal alloys, glass, and high-performance electronics.
Alloys of neodymium (Nd) and samarium (Sm) can be used to create strong magnets that withstand high temperatures, making them ideal for a wide variety of mission critical electronics and defense applications.
| End-use | % of 2019 Rare Earth Demand |
|---|---|
| Permanent Magnets | 38% |
| Catalysts | 23% |
| Glass Polishing Powder and Additives | 13% |
| Metallurgy and Alloys | 8% |
| Battery Alloys | 9% |
| Ceramics, Pigments and Glazes | 5% |
| Phosphors | 3% |
| Other | 4% |
The strongest known magnet is an alloy of neodymium with iron and boron. Adding other REEs such as dysprosium and praseodymium can change the performance and properties of magnets.
Hybrid and electric vehicle engines, generators in wind turbines, hard disks, portable electronics and cell phones require these magnets and elements. This role in technology makes their mining and refinement a point of concern for many nations.
For example, one megawatt of wind energy capacity requires 171 kg of rare earths, a single U.S. F-35 fighter jet requires about 427 kg of rare earths, and a Virginia-class nuclear submarine uses nearly 4.2 tonnes.
Global Reserves of Rare Earth Minerals
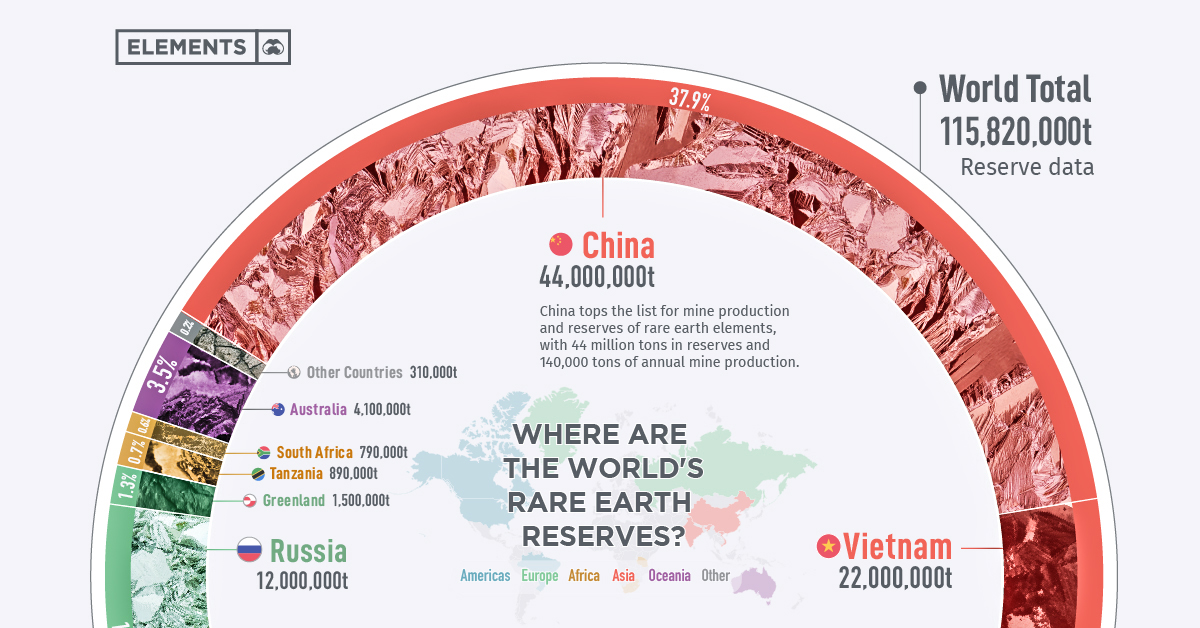
China tops the list for mine production and reserves of rare earth elements, with 44 million tons in reserves and 140,000 tons of annual mine production.
While Vietnam and Brazil have the second and third most reserves of rare earth metals with 22 million tons in reserves and 21 million tons, respectively, their mine production is among the lowest of all the countries at only 1,000 tons per year each.
| Country | Mine Production 2020 | Reserves | % of Total Reserves |
|---|---|---|---|
| China | 140,000 | 44,000,000 | 38.0% |
| Vietnam | 1,000 | 22,000,000 | 19.0% |
| Brazil | 1,000 | 21,000,000 | 18.1% |
| Russia | 2,700 | 12,000,000 | 10.4% |
| India | 3,000 | 6,900,000 | 6.0% |
| Australia | 17,000 | 4,100,000 | 3.5% |
| United States | 38,000 | 1,500,000 | 1.3% |
| Greenland | - | 1,500,000 | 1.3% |
| Tanzania | - | 890,000 | 0.8% |
| Canada | - | 830,000 | 0.7% |
| South Africa | - | 790,000 | 0.7% |
| Other Countries | 100 | 310,000 | 0.3% |
| Burma | 30,000 | N/A | N/A |
| Madagascar | 8,000 | N/A | N/A |
| Thailand | 2,000 | N/A | N/A |
| Burundi | 500 | N/A | N/A |
| World Total | 243,300 | 115,820,000 | 100% |
While the United States has 1.5 million tons in reserves, it is largely dependent on imports from China for refined rare earths.
Ensuring a Global Supply
In the rare earth industry, China’s dominance has been no accident. Years of research and industrial policy helped the nation develop a superior position in the market, and now the country has the ability to control production and the global availability of these valuable metals.
This tight control of the supply of these important metals has the world searching for their own supplies. With the start of mining operations in other countries, China’s share of global production has fallen from 92% in 2010 to 58%< in 2020. However, China has a strong foothold in the supply chain and produced 85% of the world’s refined rare earths in 2020.
China awards production quotas to only six state-run companies:
- China Minmetals Rare Earth Co
- Chinalco Rare Earth & Metals Co
- Guangdong Rising Nonferrous
- China Northern Rare Earth Group
- China Southern Rare Earth Group
- Xiamen Tungsten
As the demand for REEs increases, the world will need tap these reserves. This graphic could provide clues as to the next source of rare earth elements.


Copper
Brass Rods: The Secure Choice
This graphic shows why brass rods are the secure choice for precision-machined and forged parts.


Brass Rods: The Secure Choice
The unique combination of machinability and recyclability makes brass rods the secure choice for manufacturers seeking future-proof raw material solutions.
This infographic, from the Copper Development Association, shows three ways brass rods give manufacturers greater control and a license to grow in the competitive market for precision-machined and forged products.
Future-Proof Investments in New Machine Tools
A material’s machinability directly impacts machine throughput, which typically has the largest impact on machine shop profitability.
The high-speed machining capabilities of brass rods maximize machine tool performance, allowing manufacturers to run the material faster and longer without sacrificing tool life, chip formation, or surface quality.
The high machining efficiency of brass leads to reduced per-part costs, quicker return on investment (ROI) for new machine tools, and expanded production capacity for new projects.
Supply Security Through Closed Loop Recycling
Brass, like its parent element copper, can be infinitely recycled.
In 2022, brass- and wire-rod mills accounted for the majority of the 830,000 tonnes of copper recycled from scrap in the United States.
Given that scrap ratios for machined parts typically range from 60-70% by weight, producing mills benefit from a secure and steady supply of clean scrap returned directly from customers, which is recycled to create new brass rods.
The high residual value of brass scrap creates a strong recycling incentive. Scrap buy back programs give manufacturers greater control over raw material net costs as scrap value is often factored into supplier purchase agreements.
Next Generation Alloys for a Lead-Free Future
Increasingly stringent global regulations continue to pressure manufacturers to minimize the use of materials containing trace amounts of lead and other harmful impurities.
The latest generation of brass-rod alloys is engineered to meet the most demanding criteria for lead leaching in drinking water and other sensitive applications.
Seven brass-rod alloys passed rigorous testing to become the only ‘Acceptable Materials’ against lower lead leaching criteria recently adopted in the national U.S. drinking water quality standard, NSF 61.
Learn more about the advantages of brass rods solutions.

-

 Mining1 year ago
Ranked: The World’s Largest Copper Producers
Many new technologies critical to the energy transition rely on copper. Here are the world’s largest copper producers.
-

 Energy2 years ago
Mapped: Solar Power by Country in 2021
In 2020, solar power saw its largest-ever annual capacity expansion at 127 gigawatts. Here’s a snapshot of solar power capacity by country.
-

 Batteries5 years ago
Visualizing Copper’s Role in the Transition to Clean Energy
A clean energy transition is underway as wind, solar, and batteries take center stage. Here’s how copper plays the critical role in these technologies.
-

 Copper5 years ago
Everything You Need to Know on VMS Deposits
Deep below the ocean’s waves, VMS deposits spew out massive amounts of minerals like copper, zinc, and gold, making them a key source of the metals…
-
 Copper5 years ago
How Much Copper is in an Electric Vehicle?
Have you ever wondered how much copper is in an electric vehicle? This infographic shows the metal’s properties as well as the quantity of copper used.
-
 Batteries6 years ago
Copper: Driving the Green Energy Revolution
Renewable energy is set to fuel a new era of copper demand – here’s how much copper is used in green applications from EVs to photovoltaics.


-

 Real Estate2 weeks ago
Visualizing America’s Shortage of Affordable Homes
-

 Technology1 week ago
Ranked: Semiconductor Companies by Industry Revenue Share
-

 Money1 week ago
Which States Have the Highest Minimum Wage in America?
-

 Real Estate1 week ago
Ranked: The Most Valuable Housing Markets in America
-

 Business2 weeks ago
Charted: Big Four Market Share by S&P 500 Audits
-

 AI2 weeks ago
The Stock Performance of U.S. Chipmakers So Far in 2024
-

 Misc2 weeks ago
Almost Every EV Stock is Down After Q1 2024
-

 Money2 weeks ago
Where Does One U.S. Tax Dollar Go?