Advertising
Ranked: The Reputation of 100 Major Brands in the U.S.
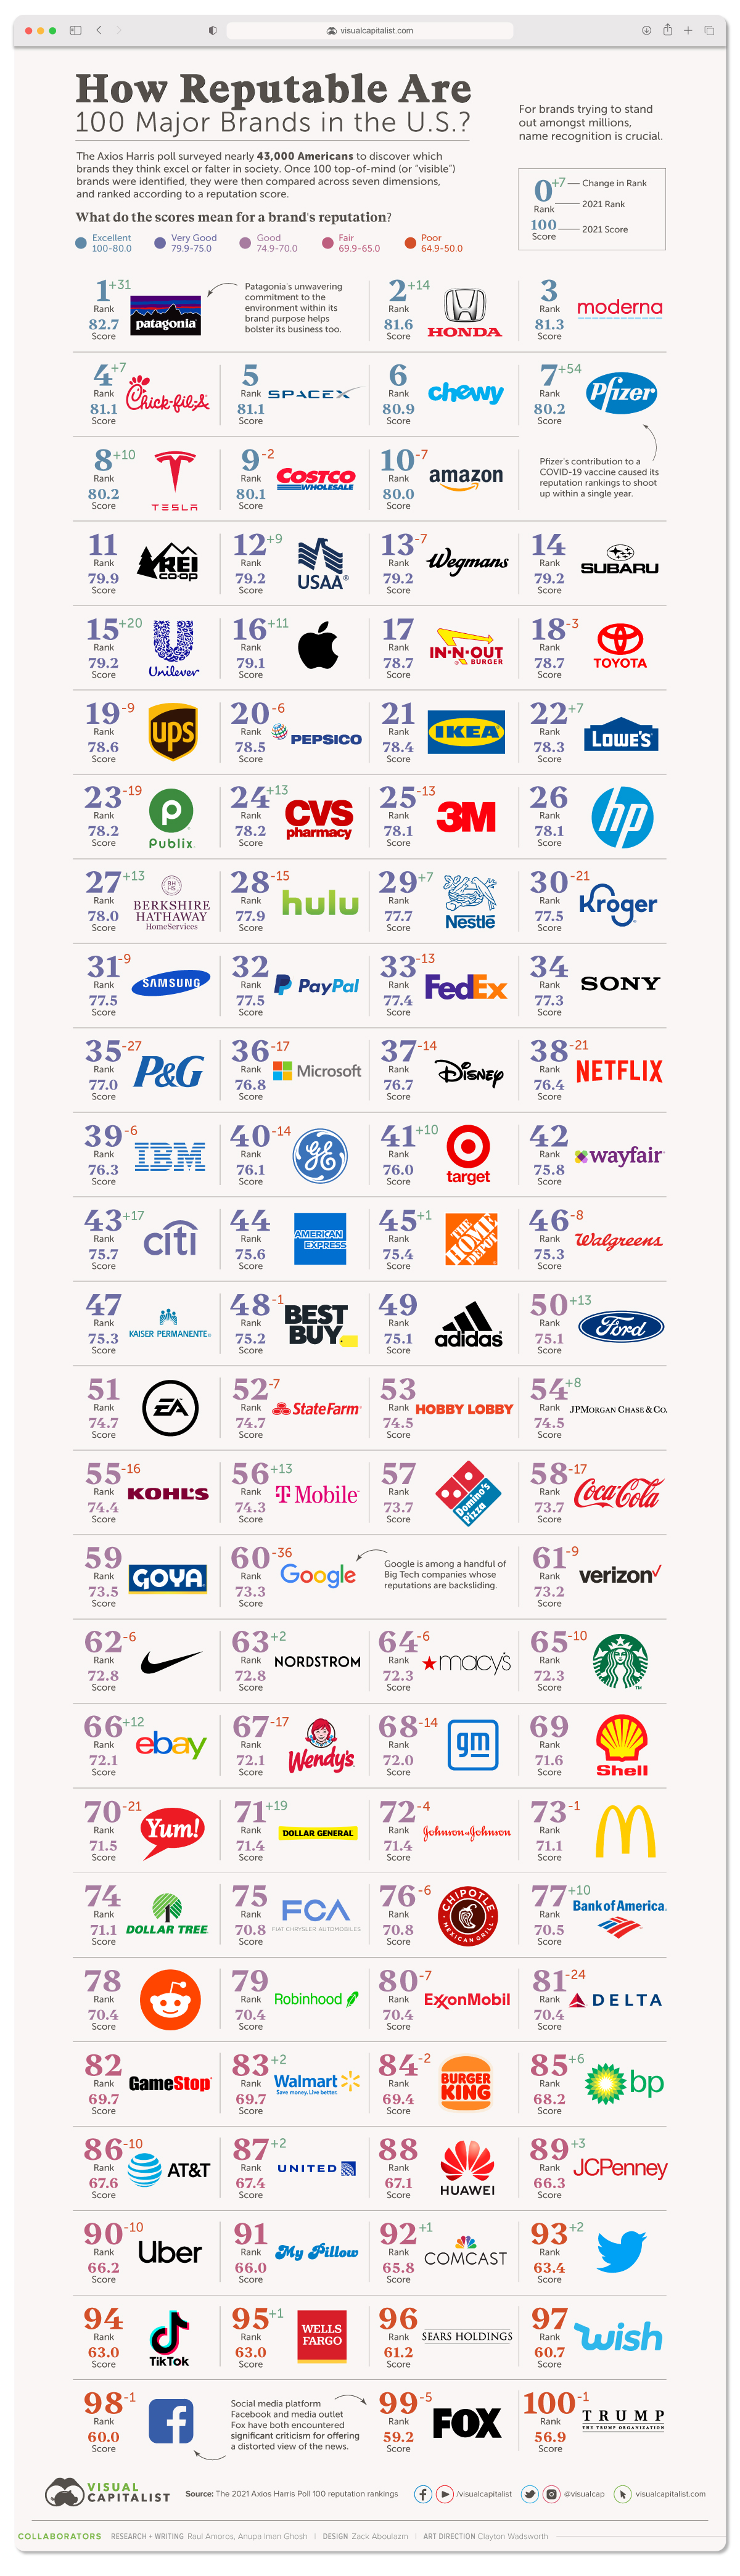


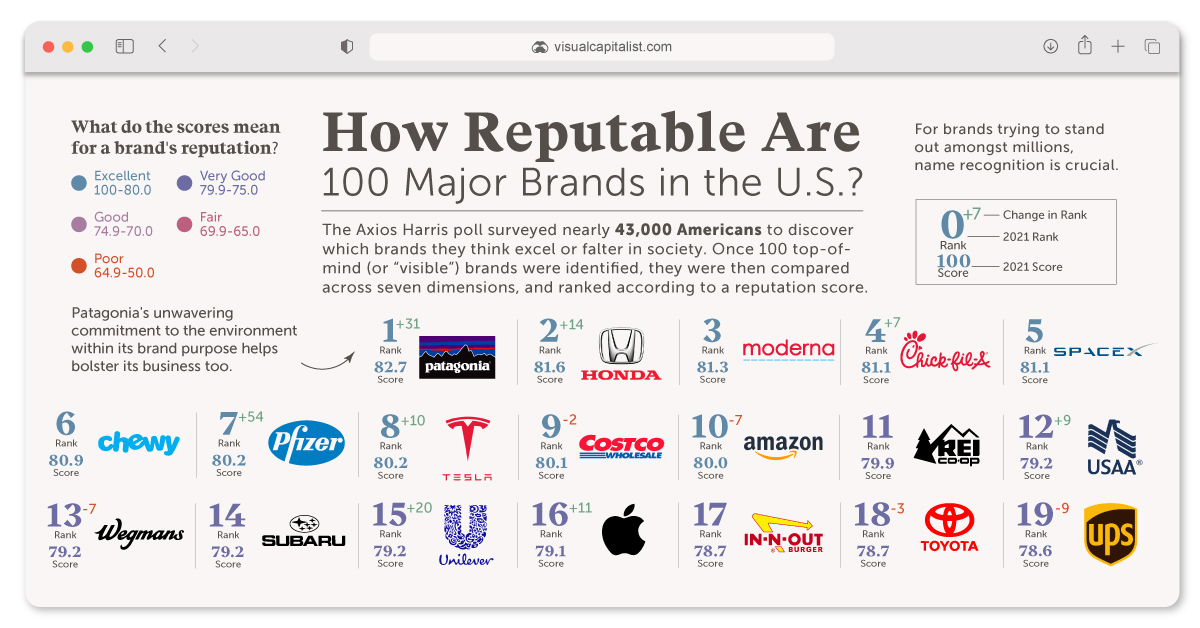
Ranked: The Reputation of 100 Major Brands in the U.S.
Whether you’re a country or a company, brand reputation is crucial. For corporations trying to stand out amongst an array of competitors, name recognition can be make or break.
The Axios Harris Poll polled a nationally representative sample of nearly 43,000 Americans to find out which 100 companies emerge as top of mind—for better or for worse.
How is Brand Reputation Measured?
The polling process started by asking respondents which two companies they felt excelled or faltered in the U.S.—in other words, which companies were the most “visible” in their eyes.
The top 100 brands that emerged from this framework were then judged by poll respondents across seven dimensions, over three key pillars:
- Character
Includes a company’s culture, ethics, and citizenship (whether a consumer shares a company’s values or the company supports good causes) - Trajectory
Includes a company’s growth prospects, vision for the future, and product and service offerings (whether they are innovative, and of high quality) - Trust
Does a consumer trust the brand in the first place?
Once these dimensions are taken into account, the final scores portray how these “visible brands” rank in terms of their reputation among a representative sample of Americans:
- Score range: 80.0 and above
Reputation: Excellent - Score range: 75.0-79.9
Reputation: Very Good - Score range: 70.0-74.9
Reputation: Good - Score range: 65.0-69.9
Reputation: Fair - Score range: 64.9 and below
Reputation: Poor
Companies with a Very Poor reputation (a score below 50) didn’t make it into the list. Here’s how the 100 most visible companies stack up in terms of brand reputation:
| 2021 Rank | Company | 2021 Score | Overall Reputation |
|---|---|---|---|
| #1 | Patagonia | 82.7 | Excellent |
| #2 | Honda Motor Company | 81.6 | Excellent |
| #3 | Moderna | 81.3 | Excellent |
| #4 | Chick-fil-A | 81.1 | Excellent |
| #5 | SpaceX | 81.1 | Excellent |
| #6 | Chewy | 80.9 | Excellent |
| #7 | Pfizer | 80.2 | Excellent |
| #8 | Tesla Motors | 80.2 | Excellent |
| #9 | Costco | 80.1 | Excellent |
| #10 | Amazon.com | 80.0 | Excellent |
| #11 | REI | 79.9 | Very Good |
| #12 | USAA | 79.2 | Very Good |
| #13 | Wegmans | 79.2 | Very Good |
| #14 | Subaru | 79.2 | Very Good |
| #15 | Unilever | 79.2 | Very Good |
| #16 | Apple | 79.1 | Very Good |
| #17 | In-n-Out Burger | 78.7 | Very Good |
| #18 | Toyota Motor Corporation | 78.7 | Very Good |
| #19 | UPS | 78.6 | Very Good |
| #20 | PepsiCo | 78.5 | Very Good |
| #21 | IKEA | 78.4 | Very Good |
| #22 | Lowe's | 78.3 | Very Good |
| #23 | Publix Supermarkets | 78.2 | Very Good |
| #24 | CVS (CVS Health) | 78.2 | Very Good |
| #25 | 3M Company | 78.1 | Very Good |
| #26 | HP, Inc. | 78.1 | Very Good |
| #27 | Berkshire Hathaway | 78.0 | Very Good |
| #28 | Hulu | 77.9 | Very Good |
| #29 | Nestle | 77.7 | Very Good |
| #30 | The Kroger Company | 77.5 | Very Good |
| #31 | Samsung | 77.5 | Very Good |
| #32 | Paypal | 77.5 | Very Good |
| #33 | FedEx Corporation | 77.4 | Very Good |
| #34 | Sony | 77.3 | Very Good |
| #35 | Procter & Gamble Co. | 77.0 | Very Good |
| #36 | Microsoft | 76.8 | Very Good |
| #37 | The Walt Disney Company | 76.7 | Very Good |
| #38 | Netflix | 76.4 | Very Good |
| #39 | IBM | 76.3 | Very Good |
| #40 | General Electric | 76.1 | Very Good |
| #41 | Target | 76.0 | Very Good |
| #42 | Wayfair | 75.8 | Very Good |
| #43 | Citigroup | 75.7 | Very Good |
| #44 | American Express | 75.6 | Very Good |
| #45 | The Home Depot | 75.4 | Very Good |
| #46 | Walgreens | 75.3 | Very Good |
| #47 | Kaiser Permanente | 75.3 | Very Good |
| #48 | Best Buy | 75.2 | Very Good |
| #49 | Adidas | 75.1 | Very Good |
| #50 | Ford Motor Company | 75.1 | Very Good |
| #51 | Electronic Arts, Inc. | 74.7 | Good |
| #52 | State Farm Insurance | 74.7 | Good |
| #53 | Hobby Lobby | 74.5 | Good |
| #54 | JPMorgan Chase & Co. | 74.5 | Good |
| #55 | Kohl's | 74.4 | Good |
| #56 | T-Mobile | 74.3 | Good |
| #57 | Domino's Pizza | 73.7 | Good |
| #58 | The Coca-Cola Company | 73.7 | Good |
| #59 | Goya | 73.5 | Good |
| #60 | 73.3 | Good | |
| #61 | Verizon Communications | 73.2 | Good |
| #62 | Nike | 72.8 | Good |
| #63 | Nordstrom | 72.8 | Good |
| #64 | Macy's | 72.3 | Good |
| #65 | Starbucks Corporation | 72.3 | Good |
| #66 | eBay | 72.1 | Good |
| #67 | Wendy's | 72.1 | Good |
| #68 | General Motors | 72.0 | Good |
| #69 | Royal Dutch Shell | 71.6 | Good |
| #70 | Yum! Brands | 71.5 | Good |
| #71 | Dollar General | 71.4 | Good |
| #72 | Johnson & Johnson | 71.4 | Good |
| #73 | McDonald's | 71.1 | Good |
| #74 | Dollar Tree | 71.1 | Good |
| #75 | Fiat Chrysler Automobiles | 70.8 | Good |
| #76 | Chipotle | 70.8 | Good |
| #77 | Bank of America | 70.5 | Good |
| #78 | 70.4 | Good | |
| #79 | Robinhood | 70.4 | Good |
| #80 | ExxonMobil | 70.4 | Good |
| #81 | Delta Air Lines | 70.4 | Good |
| #82 | GameStop | 69.7 | Fair |
| #83 | Walmart | 69.7 | Fair |
| #84 | Burger King | 69.4 | Fair |
| #85 | BP | 68.2 | Fair |
| #86 | AT&T | 67.6 | Fair |
| #87 | United Airlines | 67.4 | Fair |
| #88 | Huawei Technologies | 67.1 | Fair |
| #89 | JCPenney | 66.3 | Fair |
| #90 | Uber | 66.2 | Fair |
| #91 | My Pillow | 66.0 | Fair |
| #92 | Comcast | 65.8 | Fair |
| #93 | 63.4 | Poor | |
| #94 | TikTok | 63.0 | Poor |
| #95 | Wells Fargo & Company | 63.0 | Poor |
| #96 | Sears Holdings Corporation | 61.2 | Poor |
| #97 | Wish.com | 60.7 | Poor |
| #98 | 60.0 | Poor | |
| #99 | Fox Corporation | 59.2 | Poor |
| #100 | The Trump Organization | 56.9 | Poor |
While the ranking itself highlights well-respected and poorly-viewed brands overall, another perspective is to look at which brands shot up in the list, and which ones plummeted.
Fastest Risers in Brand Reputation
Unwavering and bold commitments to the environment has helped Patagonia to top the charts as the #1 brand, rising 31 ranks since 2020. From funneling 1% of sales into environmental donations to ensuring ethical supply chains, Patagonia’s culture, ethics, and citizenship all align with its business model in consumers’ eyes.
With over 33 million COVID-19 vaccine doses administered daily around the world, Pfizer’s contribution to the ongoing immunization progress is undeniable. As a result, its overall ranking has swelled by 54 places since 2020.
| Rank in 2021 | Brand | 2021 Score | Change |
|---|---|---|---|
| #7 | Pfizer | 80.2 | +54 |
| #1 | Patagonia | 82.7 | +31 |
| #15 | Unilever | 79.2 | +20 |
| #71 | Dollar General | 71.4 | +19 |
| #43 | Citigroup | 75.7 | +17 |
| #2 | Honda Motor Company | 81.6 | +14 |
| #24 | CVS (CVS Health) | 78.2 | +13 |
| #27 | Berkshire Hathaway | 78 | +13 |
| #50 | Ford Motor Company | 75.1 | +13 |
| #56 | T-Mobile | 74.3 | +13 |
Dollar General might seem like a surprising addition to this table, but in terms of sheer growth, discount stores are thriving. Across America, dollar stores are opening at a rate of three per day, faster than any Starbucks or McDonalds.
There’s a crucial reason for this: in many rural areas, millions rely on dollar stores for food and other essentials, as the nearest grocery store can be nearly an hour’s drive away.
Biggest Decliners in Brand Reputation
Despite steady revenue growth, Google is among a handful of Big Tech companies whose reputations are backsliding, dropping 36 places in the past year. The outsize power and influence these companies hold is increasingly coming under regulatory scrutiny.
| Rank in 2021 | Brand | 2021 Score | Change |
|---|---|---|---|
| #60 | 73.3 | -36 | |
| #35 | Procter & Gamble Co. | 77 | -27 |
| #81 | Delta Air Lines | 70.4 | -24 |
| #30 | The Kroger Company | 77.5 | -21 |
| #38 | Netflix | 76.4 | -21 |
| #70 | Yum! Brands | 71.5 | -21 |
| #23 | Publix Supermarkets | 78.2 | -19 |
| #36 | Microsoft | 76.8 | -17 |
| #58 | The Coca-Cola Company | 73.7 | -17 |
| #67 | Wendy's | 72.1 | -17 |
Although Netflix pioneered the world of streaming, it is now facing stiff competition from emerging subscription services. Amazon’s latest acquisition of Metro-Goldwyn-Mayer (MGM Studios) will especially bolster the content catalog available on Prime Video.
Building a Brand Reputation Doesn’t Come Easy
Near the bottom of the 100 companies leaderboard, the struggles of mainstream media and modern information dissemination are strongly reflected. Despite their diverse audiences and established histories, brand reputations of both Facebook and Fox News have eroded in recent years.
This example highlights how the nature of a brand’s reputation can evolve over time. Building a strong and reputable brand may be subjective, but its effects on consumer loyalty are powerful.


Revenue
Charting Revenue: How The New York Times Makes Money
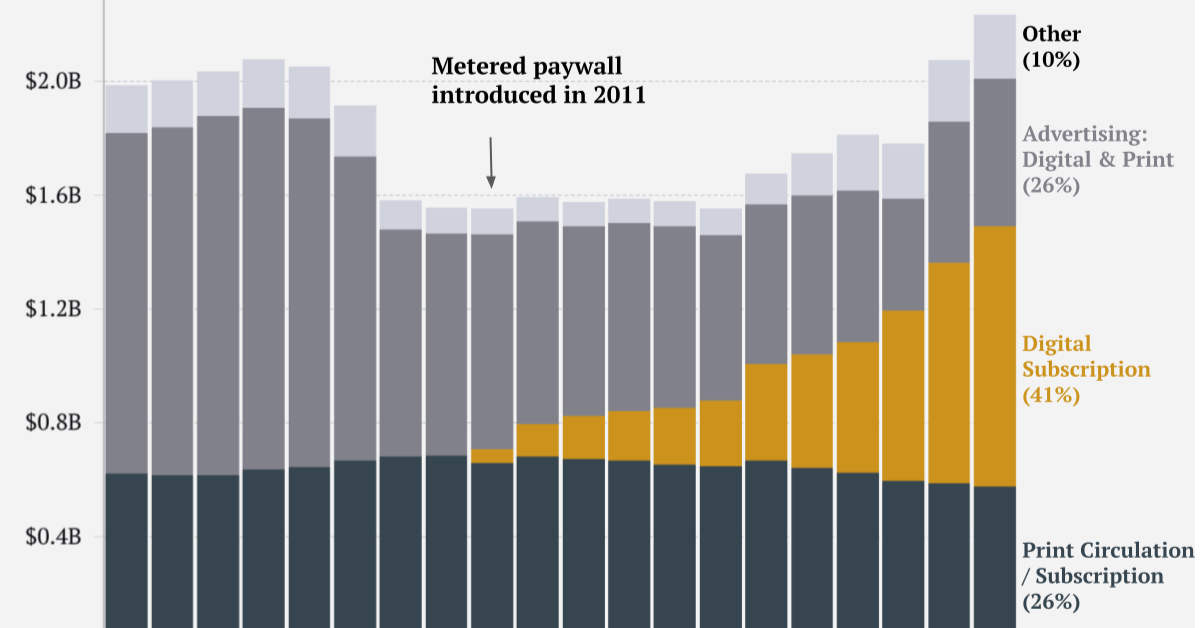
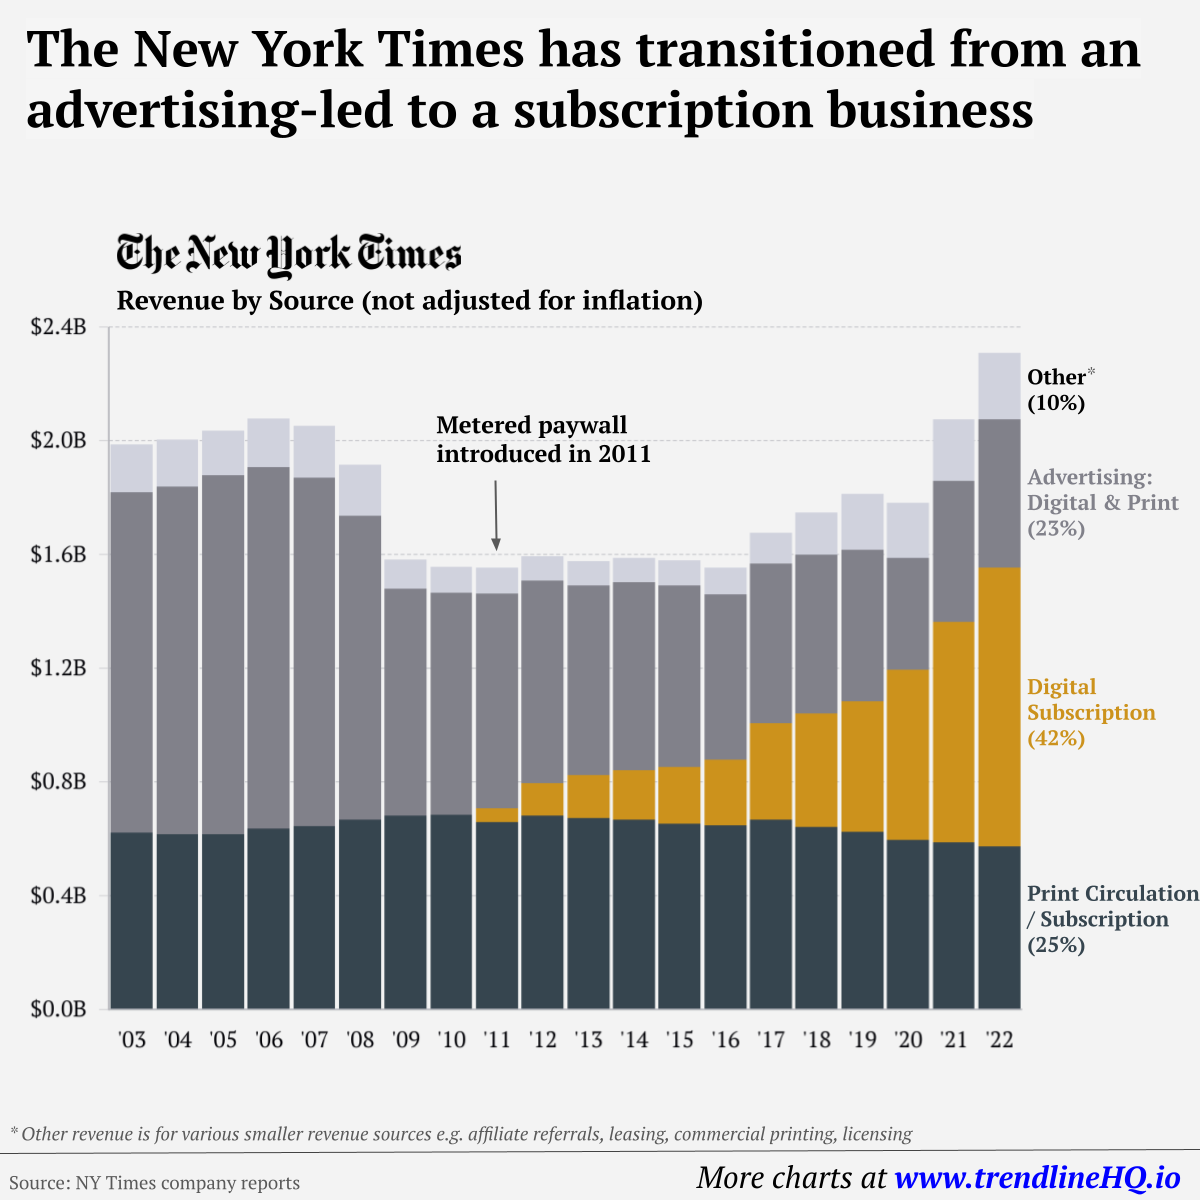
This graphic tracks the New York Times’ revenue streams over the past two decades, identifying its transition from advertising to subscription-reliant.
 Creator Program
When it comes to quality and accessible content, whether it be entertainment or news, consumers are often willing to pay for it.
Similar to the the precedent set by the music industry, many news outlets have also been figuring out how to transition into a paid digital monetization model. Over the past decade or so, The New York Times (NY Times)—one of the world’s most iconic and widely read news organizations—has been transforming its revenue model to fit this trend.
This chart from creator Trendline uses annual reports from the The New York Times Company to visualize how this seemingly simple transition helped the organization adapt to the digital era.
The New York Times’ Revenue Transition
The NY Times has always been one of the world’s most-widely circulated papers. Before the launch of its digital subscription model, it earned half its revenue from print and online advertisements.
The rest of its income came in through circulation and other avenues including licensing, referrals, commercial printing, events, and so on. But after annual revenues dropped by more than $500 million from 2006 to 2010, something had to change.
| NY Revenue By Year | Print Circulation | Digital Subscription | Advertising | Other | Total |
|---|---|---|---|---|---|
| 2003 | $623M | $1,196M | $168M | $1,987M | |
| 2004 | $616M | $1,222M | $165M | $2,003M | |
| 2005 | $616M | $1,262M | $157M | $2,035M | |
| 2006 | $637M | $1,269M | $172M | $2,078M | |
| 2007 | $646M | $1,223M | $183M | $2,052M | |
| 2008 | $668M | $1,068M | $181M | $1,917M | |
| 2009 | $683M | $797M | $101M | $1,581M | |
| 2010 | $684M | $780M | $93M | $1,557M | |
| 2011 | $659M | $47M | $756M | $93M | $1,555M |
| 2012 | $681M | $114M | $712M | $88M | $1,595M |
| 2013 | $673M | $151M | $667M | $86M | $1,577M |
| 2014 | $668M | $172M | $662M | $86M | $1,588M |
| 2015 | $653M | $199M | $639M | $89M | $1,580M |
| 2016 | $647M | $232M | $581M | $94M | $1,554M |
| 2017 | $668M | $340M | $559M | $109M | $1,676M |
| 2018 | $642M | $400M | $558M | $148M | $1,748M |
| 2019 | $624M | $460M | $531M | $198M | $1,813M |
| 2020 | $597M | $598M | $392M | $196M | $1,783M |
| 2021 | $588M | $774M | $498M | $215M | $2,075M |
| 2022 | $574M | $979M | $523M | $233M | $2,308M |
In 2011, the NY Times launched its new digital subscription model and put some of its online articles behind a paywall. It bet that consumers would be willing to pay for quality content.
And while it faced a rocky start, with revenue through print circulation and advertising slowly dwindling and some consumers frustrated that once-available content was now paywalled, its income through digital subscriptions began to climb.
After digital subscription revenues first launched in 2011, they totaled to $47 million of revenue in their first year. By 2022 they had climbed to $979 million and accounted for 42% of total revenue.
Why Are Readers Paying for News?
More than half of U.S. adults subscribe to the news in some format. That (perhaps surprisingly) includes around four out of 10 adults under the age of 35.
One of the main reasons cited for this was the consistency of publications in covering a variety of news topics.
And given the NY Times’ popularity, it’s no surprise that it recently ranked as the most popular news subscription.

-

 Real Estate2 weeks ago
Visualizing America’s Shortage of Affordable Homes
-

 Technology1 week ago
Ranked: Semiconductor Companies by Industry Revenue Share
-

 Money1 week ago
Which States Have the Highest Minimum Wage in America?
-

 Real Estate1 week ago
Ranked: The Most Valuable Housing Markets in America
-

 Business1 week ago
Charted: Big Four Market Share by S&P 500 Audits
-

 AI2 weeks ago
The Stock Performance of U.S. Chipmakers So Far in 2024
-

 Misc2 weeks ago
Almost Every EV Stock is Down After Q1 2024
-

 Money2 weeks ago
Where Does One U.S. Tax Dollar Go?