Misc
Ranked: The World’s Most Surveilled Cities


Ranked: The World’s Most Surveilled Cities
This may come as a surprise, but it wasn’t until 2007 that the global urban population overtook the rural population. At that time, the two groups were split nearly 50/50, with around 3.3 billion people apiece.
Today, the percentage of people living in urban areas has grown to over 55%, and is expected to reach 68% by 2050. Due to this trend, many of the world’s largest cities have become home to tens of millions of people.
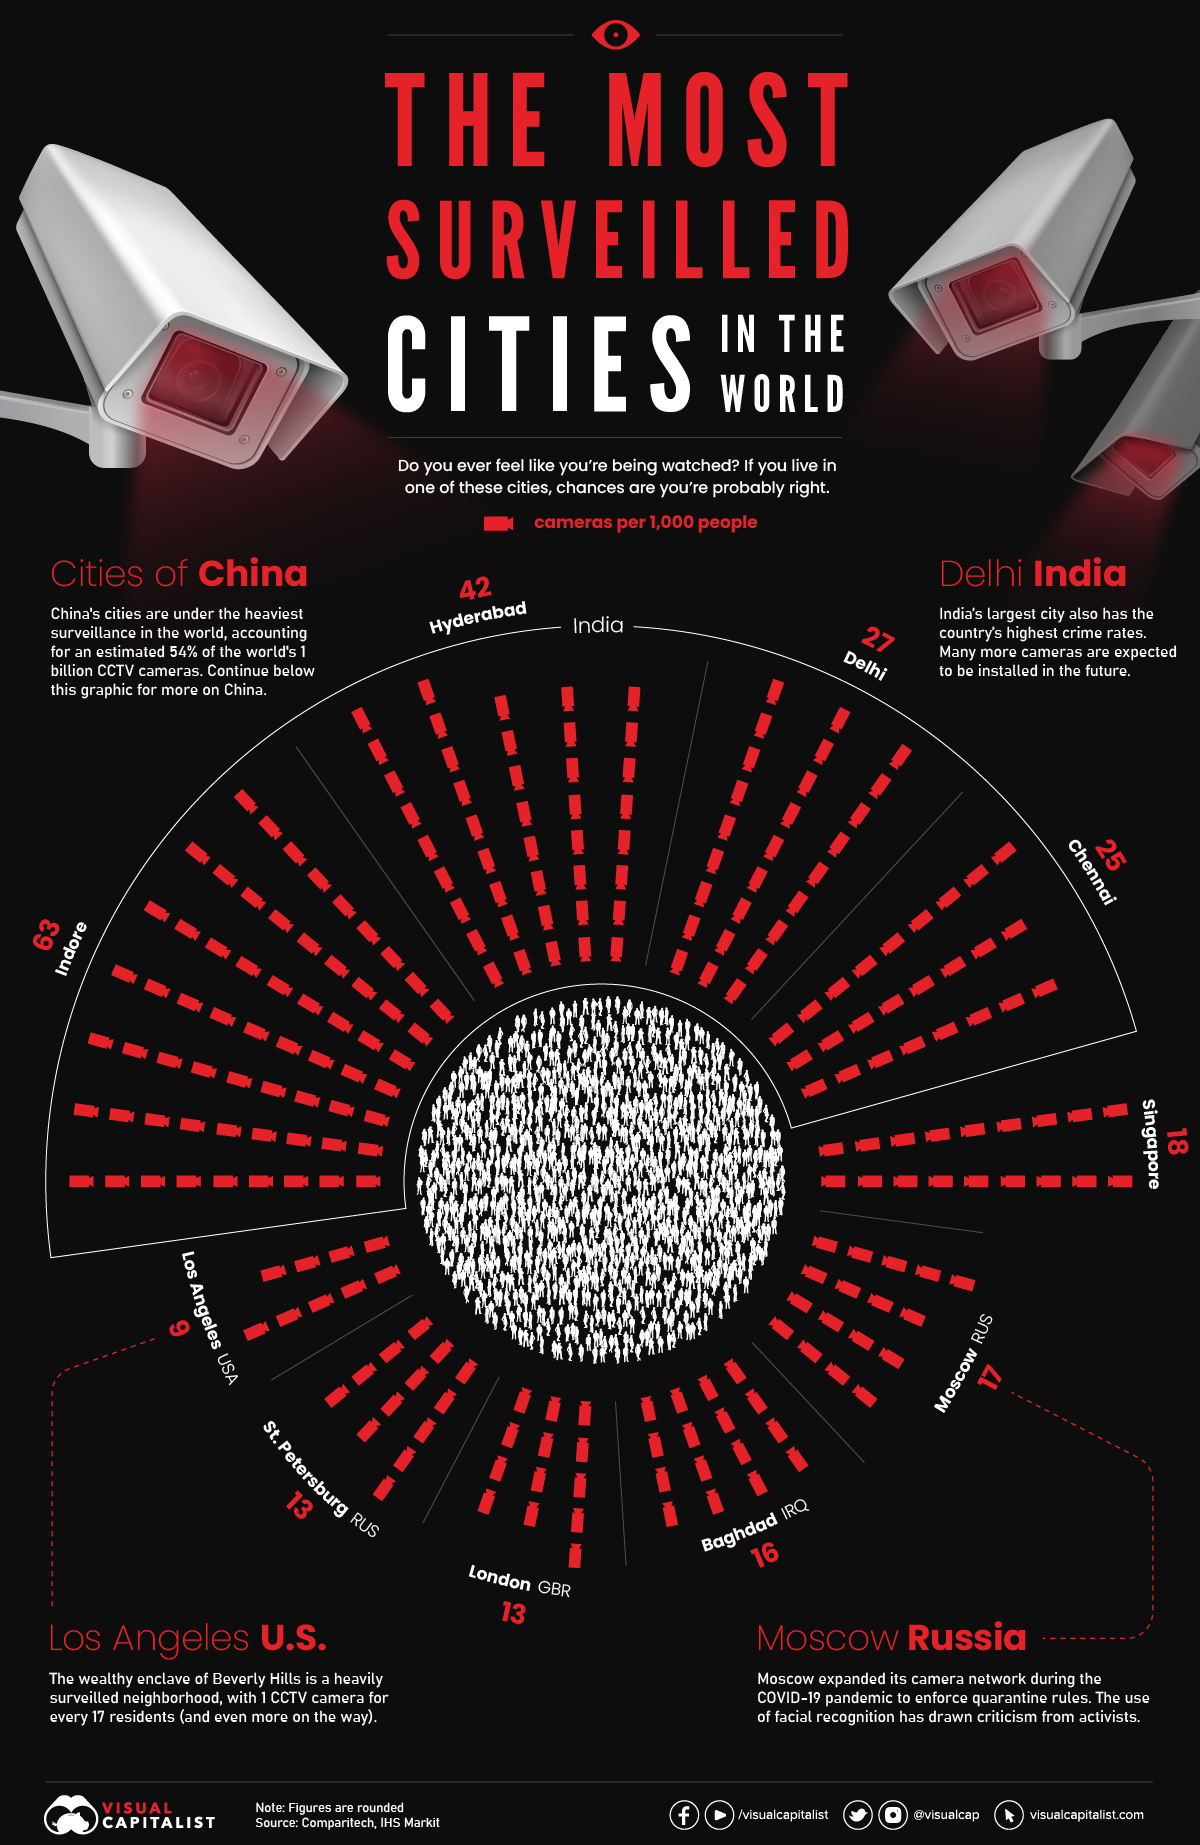
In response to such incredible density, governments, businesses, and households have installed countless security cameras for various purposes including crime protection. To grasp the scale of this surveillance, we’ve taken data from a recent report by Comparitech to visualize the most surveilled cities in the world.
The List (Excluding China)
Excluding China for the time being, these are the world’s 10 most surveilled cities.
| City | Population | Number of Cameras | Cameras per 1,000 people |
|---|---|---|---|
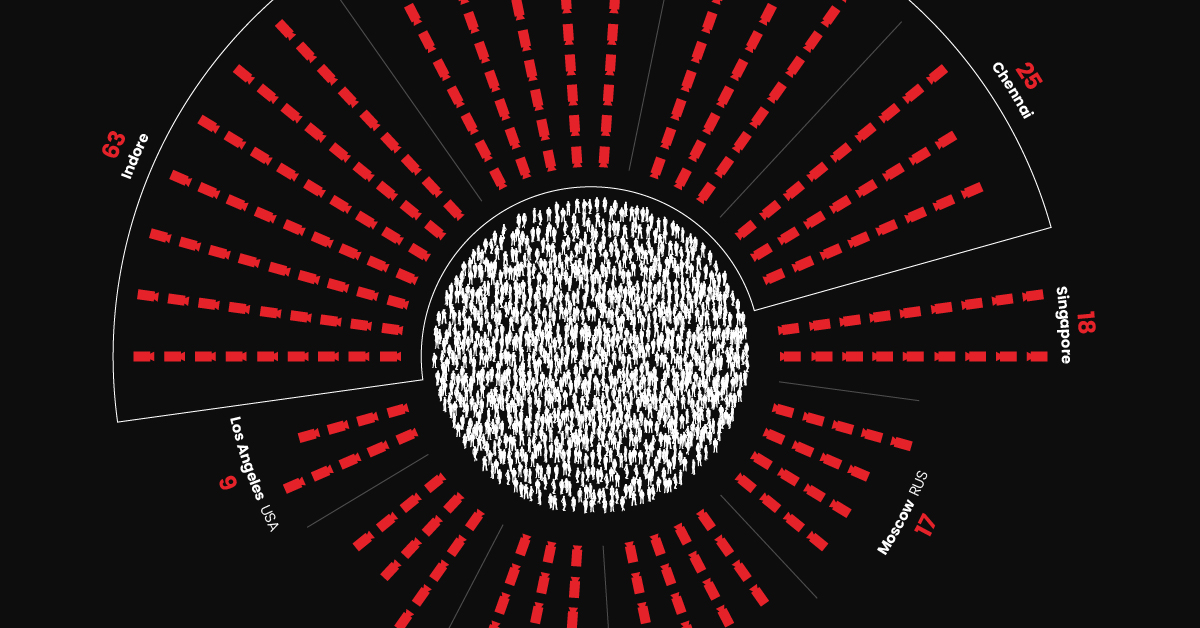
| 🇮🇳 Indore, India | 3.2M | 200,600 | 63 |
| 🇮🇳 Hyderabad, India | 10.5M | 440,299 | 42 |
| 🇮🇳 Delhi, India | 16.3M | 436,600 | 27 |
| 🇮🇳 Chennai, India | 11.5M | 282,126 | 25 |
| 🇸🇬 Singapore | 6.0M | 108,981 | 18 |
| 🇷🇺 Moscow, Russia | 12.6M | 213,000 | 17 |
| 🇮🇶 Baghdad, Iraq | 7.5M | 120,000 | 16 |
| 🇬🇧 London, UK | 9.5M | 127,373 | 13 |
| 🇷🇺 St. Petersburg, Russia | 5.5M | 70,000 | 13 |
| 🇺🇸 Los Angeles, U.S. | 3.9M | 34,959 | 9 |
Figures rounded
The top four cities all belong to India, which is the world’s second largest country by population. Surveillance cameras are playing a major role in the country’s efforts to reduce crimes against women.
Further down the list are cities from a variety of countries. One of these is Russia, which has expanded its use of surveillance cameras in recent years. Given the country’s track record of human rights violations, activists are worried that facial recognition technology could become a tool of oppression.
The only U.S. city on the list is Los Angeles, which contains some of the country’s wealthiest neighborhoods and municipalities. That includes Beverly Hills, which according to the Los Angeles Times, has over 2,000 cameras for its population of 32,500. That translates to about 62 cameras per 1,000 people, meaning that Beverly Hills would finish at #2 in the global ranking if it were listed as a separate entity.
Surveillance in China
IHS Markit estimates that as of 2021, there are over 1 billion surveillance cameras installed worldwide. The firm also believes that 54% of these cameras are located in China.
Because of limited transparency, it’s impossible to pinpoint how many cameras are actually in each Chinese city. However, if we assume that China has 540 million cameras and divide that amongst its population of 1.46 billion, we can reasonably say that there are 373 cameras per 1,000 people (figures rounded).
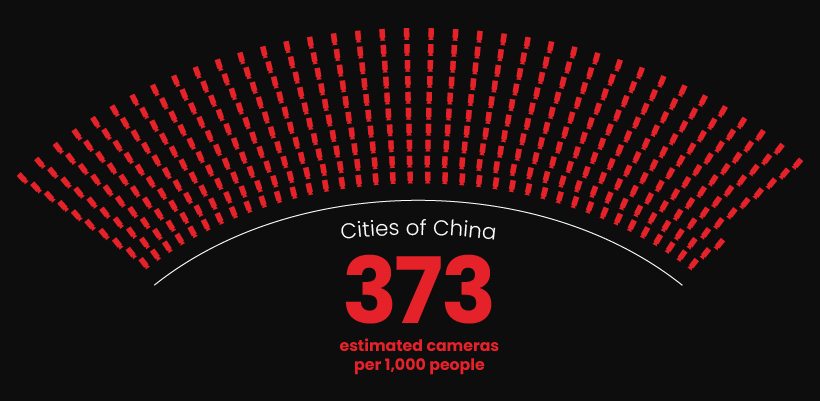
A limitation of this approach is that it assumes everyone in China lives in a city, which is far from reality. The most recent World Bank figures suggest that 37% of China’s population is rural, which equates to over 500 million people.
With this in mind, the number of cameras per 1,000 people in a Tier 1+ Chinese city (e.g. Shanghai) is likely far greater than 373.
More About China
China’s expansive use of cameras and facial recognition technology has been widely documented in the media. These networks enable the country’s social credit program, which gives local governments an unprecedented amount of oversight over its citizens.
For example, China’s camera networks can be used to verify ATM withdrawals, permit access into homes, and even publicly shame people for minor offences like jaywalking.
This might sound like a dystopian nightmare to Western audiences, but according to Chinese citizens, it’s mostly a good thing. In a 2018 survey of 2,209 citizens, 80% of respondents approved of social credit systems.
If you’re interested in learning more about surveillance in Chinese cities, consider this video from The Economist, which explores the opportunities and dangers of comprehensive state control.


VC+
VC+: Get Our Key Takeaways From the IMF’s World Economic Outlook
A sneak preview of the exclusive VC+ Special Dispatch—your shortcut to understanding IMF’s World Economic Outlook report.

Have you read IMF’s latest World Economic Outlook yet? At a daunting 202 pages, we don’t blame you if it’s still on your to-do list.
But don’t worry, you don’t need to read the whole April release, because we’ve already done the hard work for you.
To save you time and effort, the Visual Capitalist team has compiled a visual analysis of everything you need to know from the report—and our upcoming VC+ Special Dispatch will be available exclusively to VC+ members on Thursday, April 25th.
If you’re not already subscribed to VC+, make sure you sign up now to receive the full analysis of the IMF report, and more (we release similar deep dives every week).
For now, here’s what VC+ members can expect to receive.
Your Shortcut to Understanding IMF’s World Economic Outlook
With long and short-term growth prospects declining for many countries around the world, this Special Dispatch offers a visual analysis of the key figures and takeaways from the IMF’s report including:
- The global decline in economic growth forecasts
- Real GDP growth and inflation forecasts for major nations in 2024
- When interest rate cuts will happen and interest rate forecasts
- How debt-to-GDP ratios have changed since 2000
- And much more!

Get the Full Breakdown in the Next VC+ Special Dispatch
VC+ members will receive the full Special Dispatch on Thursday, April 25th.
Make sure you join VC+ now to receive exclusive charts and the full analysis of key takeaways from IMF’s World Economic Outlook.
Don’t miss out. Become a VC+ member today.
What You Get When You Become a VC+ Member
VC+ is Visual Capitalist’s premium subscription. As a member, you’ll get the following:
- Special Dispatches: Deep dive visual briefings on crucial reports and global trends
- Markets This Month: A snappy summary of the state of the markets and what to look out for
- The Trendline: Weekly curation of the best visualizations from across the globe
- Global Forecast Series: Our flagship annual report that covers everything you need to know related to the economy, markets, geopolitics, and the latest tech trends
- VC+ Archive: Hundreds of previously released VC+ briefings and reports that you’ve been missing out on, all in one dedicated hub
You can get all of the above, and more, by joining VC+ today.

-

 Maps1 week ago
The Largest Earthquakes in the New York Area (1970-2024)
-

 Money2 weeks ago
Where Does One U.S. Tax Dollar Go?
-

 Automotive2 weeks ago
Almost Every EV Stock is Down After Q1 2024
-

 AI2 weeks ago
The Stock Performance of U.S. Chipmakers So Far in 2024
-

 Markets2 weeks ago
Charted: Big Four Market Share by S&P 500 Audits
-

 Real Estate2 weeks ago
Ranked: The Most Valuable Housing Markets in America
-

 Money2 weeks ago
Which States Have the Highest Minimum Wage in America?
-

 AI2 weeks ago
Ranked: Semiconductor Companies by Industry Revenue Share