Money
Ranked: The U.S. Banks With the Most Uninsured Deposits
![]() Subscribe to the Elements free mailing list for more like this
Subscribe to the Elements free mailing list for more like this
The U.S. Top Banks by Uninsured Deposits
This was originally posted on Elements. Sign up to the free mailing list to get beautiful visualizations on natural resource megatrends in your email every week.
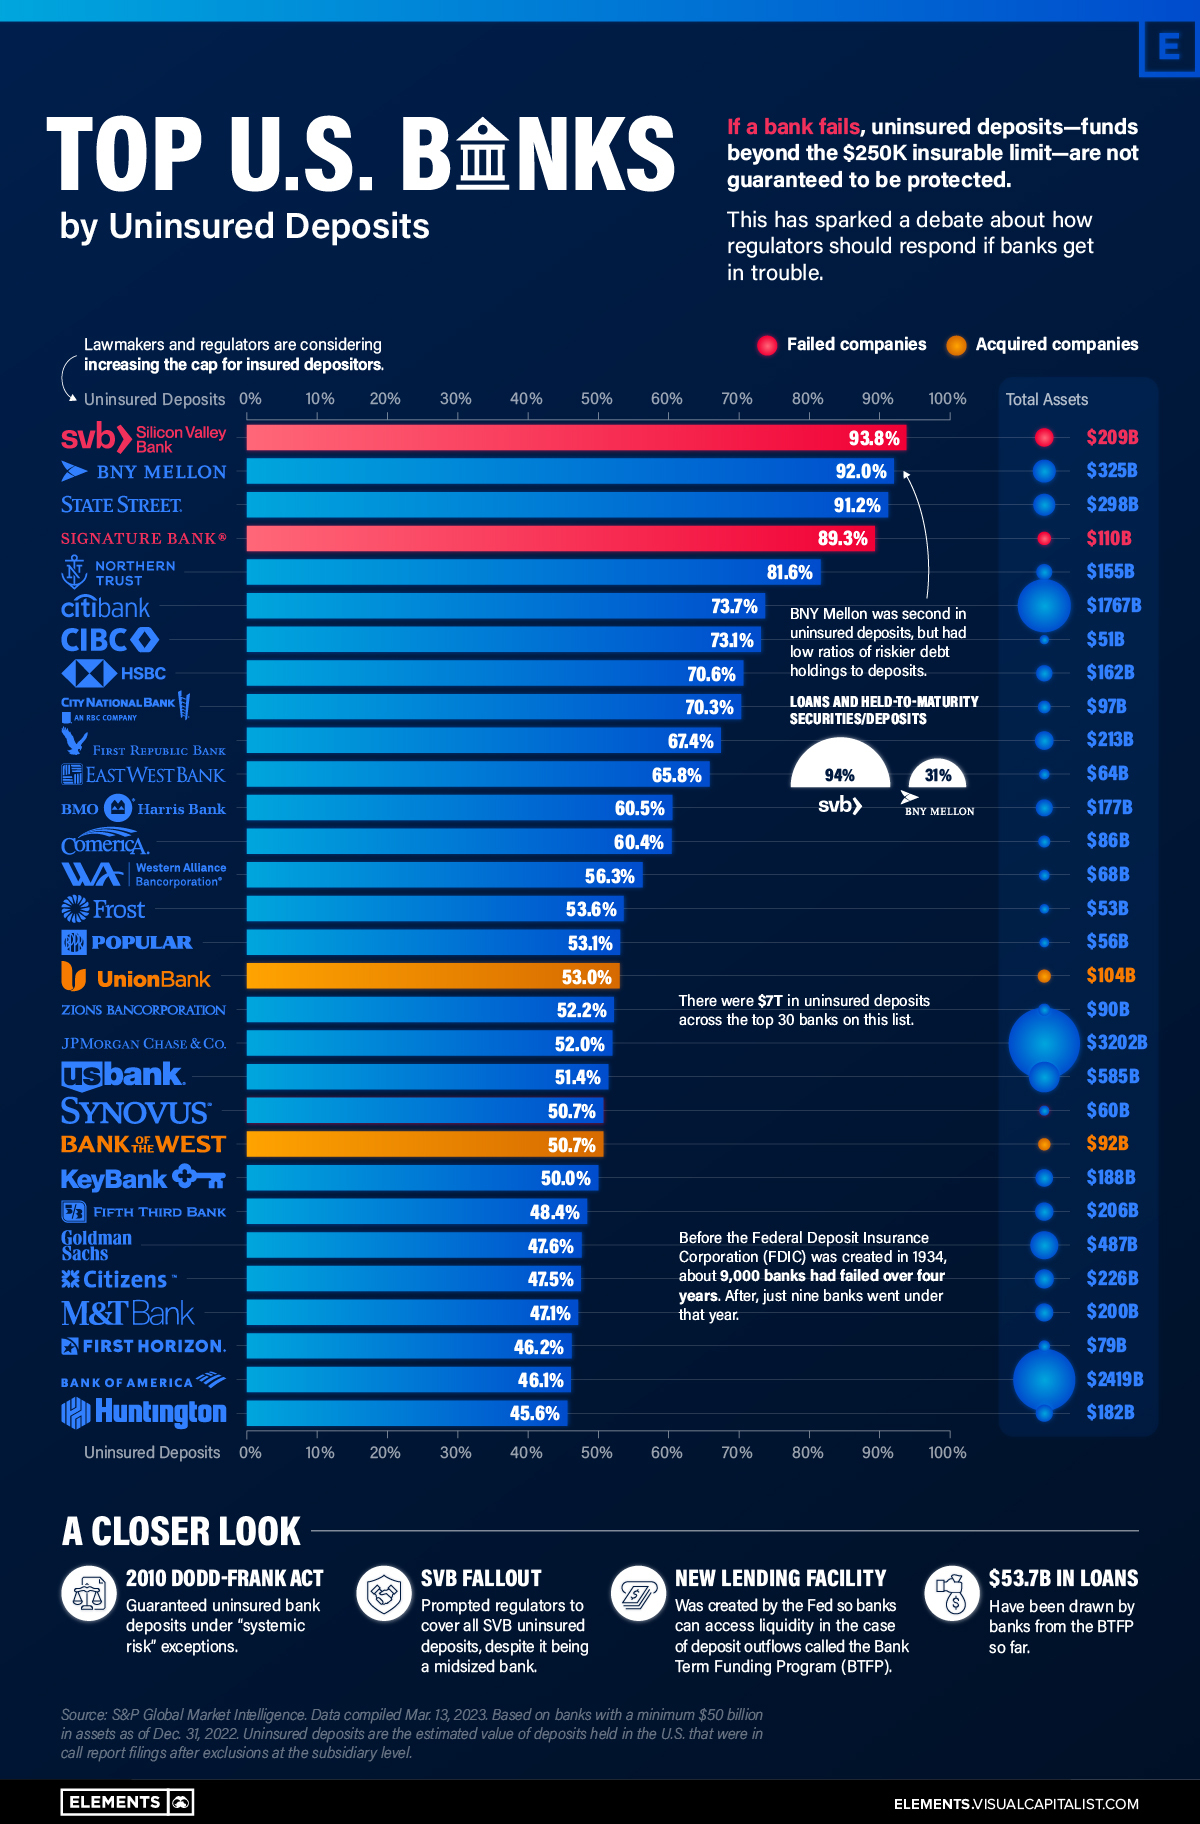
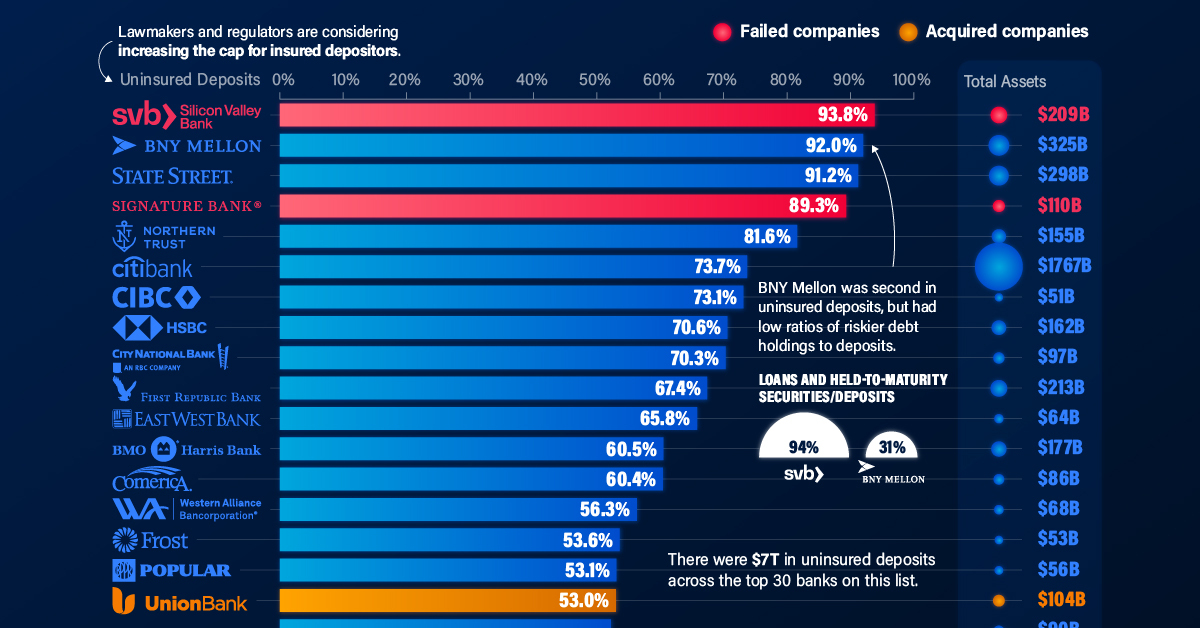
Today, there is at least $7 trillion in uninsured bank deposits in America.
This dollar value is roughly three times that of Apple’s market capitalization, or about equal to 30% of U.S. GDP. Uninsured deposits are ones that exceed the $250,000 limit insured by the Federal Deposit Insurance Corporation (FDIC), which was actually increased from $100,000 after the Global Financial Crisis. They account for roughly 40% of all bank deposits.
In the wake of the Silicon Valley Bank (SVB) fallout, we look at the 30 U.S. banks with the highest percentage of uninsured deposits, using data from S&P Global.
Which Banks Have the Most Uninsured Deposits?
Over the last month, SVB and Signature Bank went under at lightning speed.
Below, we show how their level of uninsured deposits compare to other banks. The dataset includes U.S. banks with at least $50 billion in assets at the end of 2022.
| Top 30 Rank | Bank | Uninsured Deposits (%) | Total Assets (B) |
|---|---|---|---|
| 1 | Silicon Valley Bank* | 93.8 | $209 |
| 2 | Bank of New York Mellon | 92.0 | $325 |
| 3 | State Street Bank and Trust Co. | 91.2 | $298 |
| 4 | Signature Bank* | 89.3 | $110 |
| 5 | Northern Trust Co. | 81.6 | $155 |
| 6 | Citibank NA | 73.7 | $1,767 |
| 7 | CIBC Bank USA | 73.1 | $51 |
| 8 | HSBC Bank USA NA | 70.6 | $162 |
| 9 | City National Bank | 70.3 | $97 |
| 10 | First Republic Bank | 67.4 | $213 |
| 11 | East West Bank | 65.8 | $64 |
| 12 | BMO Harris Bank NA | 60.5 | $177 |
| 13 | Comerica Bank | 60.4 | $86 |
| 14 | Western Alliance Bank | 56.3 | $68 |
| 15 | Frost Bank | 53.6 | $53 |
| 16 | Banco Popular de Puerto Rico | 53.1 | $56 |
| 17 | MUFG Union Bank NA** | 53.0 | $104 |
| 18 | Zions Bancorp. NA | 52.2 | $90 |
| 19 | JPMorgan Chase Bank NA | 52 | $3,202 |
| 20 | U.S. Bank NA | 51.4 | $585 |
| 21 | Synovus Bank | 50.7 | $60 |
| 22 | Bank of the West** | 50.7 | $92 |
| 23 | KeyBank NA | 50.0 | $188 |
| 24 | Fifth Third Bank NA | 48.4 | $206 |
| 25 | Goldman Sachs Bank USA | 47.6 | $487 |
| 26 | Citizens Bank NA | 47.5 | $226 |
| 27 | Manufacturers and Traders Trust Co. | 47.1 | $200 |
| 28 | First Horizon Bank | 46.2 | $79 |
| 29 | Bank of America NA | 46.1 | $2,419 |
| 30 | Huntington National Bank | 45.6 | $182 |
*Failed banks. **Acquired banks.
Bank of New York (BNY) Mellon and State Street Bank are the active banks with the highest levels of uninsured deposits. They are the two largest custodian banks in the U.S., followed by JP Morgan. Custodian banks provide critical infrastructure in the financial system, holding assets for safe-keeping for investment managers and transferring assets, among other duties.
Both BNY Mellon and State Street are considered “systemically important” banks.
Where these banks differ from SVB is that their loans and held-to-maturity securities as a percentage of total deposits are much lower. While these loans made up over 94% of SVB’s deposits, they made up 31% of BNY Mellon’s and 40% of State Street Bank’s deposits, respectively.
Held-to-maturity securities pose a greater risk to banks. Many of these holdings have lost value since interest rates have risen at a sharp clip. This presents interest-rate risks to banks. Consider how the value of long-term U.S. Treasurys declined about 30% in 2022. In this way, if a bank sells these assets before they mature, they take on a steep loss.
Overall, 11 banks on this list have loans and held-to-maturity assets that are over 90% of their total value of deposits.
Backstop Measures
To prevent wider ramifications, regulators implemented emergency actions. This was done by protecting all deposits of SVB and Signature Bank days after they announced failure.
The Fed also set up an emergency lending facility for banks. This Bank Term Funding Program (BTFP) was created to provide additional funding for banks if depositors pulled their money. It was also set up to prevent banks from interest-rate risk.
So far, more than $50 billion in loans have been withdrawn from the BTFP, up from $11.9 billion in its first week. (The Federal Reserve updates these numbers on a weekly basis.) This has led the Fed’s balance sheet to once again tick higher after slowly declining with the introduction of quantitative tightening in 2022.
Between a Rock and a Hard Place
What does this mean for the U.S. banking system, and what are the implications for depositors and the broader financial system?
On the one hand, the Fed may have had no other option than to save the banks.
“The way the world is, the government had no alternative but to back all deposits. Or we would have had the biggest goddamn bunch of bank runs you ever saw.”
-Charles Munger
The bigger problem is that it introduces new risk into the system. If market participants expect the Fed to always come to the rescue, they will likely make less prudent decisions. Beyond this, the ultra-low interest rate environment not only made banks more sensitive to interest-rate risk as rates went up, but it also lowered the cost of risk-taking.
Now, the Fed has said that they could take necessary actions to protect uninsured deposits. How quickly BTFP loans increase in the next few months will be anyone’s guess as clients from smaller banks withdraw funds and send to larger ones or invest in money market funds.
Editor’s note: Not all types of uninsured deposits are created equal. For custodian banks, retail deposits can make up a smaller portion of total deposits while operational deposits comprise a larger share. These types of deposits hold large amounts of funds for other banks for the purposes of custody or clearing and cash management, among other functions. For this reason, they are often considered more stable forms of deposits.


Money
Charted: Who Has Savings in This Economy?
Older, better-educated adults are winning the savings game, reveals a January survey by the National Opinion Research Center at the University of Chicago.


Who Has Savings in This Economy?
This was originally posted on our Voronoi app. Download the app for free on iOS or Android and discover incredible data-driven charts from a variety of trusted sources.
Two full years of inflation have taken their toll on American households. In 2023, the country’s collective credit card debt crossed $1 trillion for the first time. So who is managing to save money in the current economic environment?
We visualize the percentage of respondents to the statement “I have money leftover at the end of the month” categorized by age and education qualifications. Data is sourced from a National Endowment for Financial Education (NEFE) report, published last month.
The survey for NEFE was conducted from January 12-14, 2024, by the National Opinion Research Center at the University of Chicago. It involved 1,222 adults aged 18+ and aimed to be representative of the U.S. population.
Older Americans Save More Than Their Younger Counterparts
General trends from this dataset indicate that as respondents get older, a higher percentage of them are able to save.
| Age | Always/Often | Sometimes | Rarely/Never |
|---|---|---|---|
| 18–29 | 29% | 33% | 38% |
| 30–44 | 36% | 27% | 37% |
| 45–59 | 39% | 23% | 38% |
| Above 60 | 49% | 28% | 23% |
| All Adults | 39% | 33% | 27% |
Note: Percentages are rounded and may not sum to 100.
Perhaps not surprisingly, those aged 60+ are the age group with the highest percentage saying they have leftover money at the end of the month. This age group spent the most time making peak earnings in their careers, are more likely to have investments, and are more likely to have paid off major expenses like a mortgage or raising a family.
The Impact of Higher Education on Earnings and Savings
Based on this survey, higher education dramatically improves one’s ability to save. Shown in the table below, those with a bachelor’s degree or higher are three times more likely to have leftover money than those without a high school diploma.
| Education | Always/Often | Sometimes | Rarely/Never |
|---|---|---|---|
| No HS Diploma | 18% | 26% | 56% |
| HS Diploma | 28% | 33% | 39% |
| Associate Degree | 33% | 31% | 36% |
| Bachelor/Higher Degree | 59% | 21% | 20% |
| All Adults | 39% | 33% | 27% |
Note: Percentages are rounded and may not sum to 100.
As the Bureau of Labor Statistics notes, earnings improve with every level of education completed.
For example, those with a high school diploma made 25% more than those without in 2022. And as the qualifications increase, the effects keep stacking.
Meanwhile, a Federal Reserve study also found that those with more education tended to make financial decisions that contributed to building wealth, of which the first step is to save.

-

 Markets1 week ago
U.S. Debt Interest Payments Reach $1 Trillion
-

 Business2 weeks ago
Charted: Big Four Market Share by S&P 500 Audits
-

 Real Estate2 weeks ago
Ranked: The Most Valuable Housing Markets in America
-

 Money2 weeks ago
Which States Have the Highest Minimum Wage in America?
-

 AI2 weeks ago
Ranked: Semiconductor Companies by Industry Revenue Share
-

 Markets2 weeks ago
Ranked: The World’s Top Flight Routes, by Revenue
-

 Demographics2 weeks ago
Population Projections: The World’s 6 Largest Countries in 2075
-

 Markets2 weeks ago
The Top 10 States by Real GDP Growth in 2023