Technology
Ranked: The Most Popular Paid Subscription News Websites


Ranked: The Most Popular Subscription News Websites
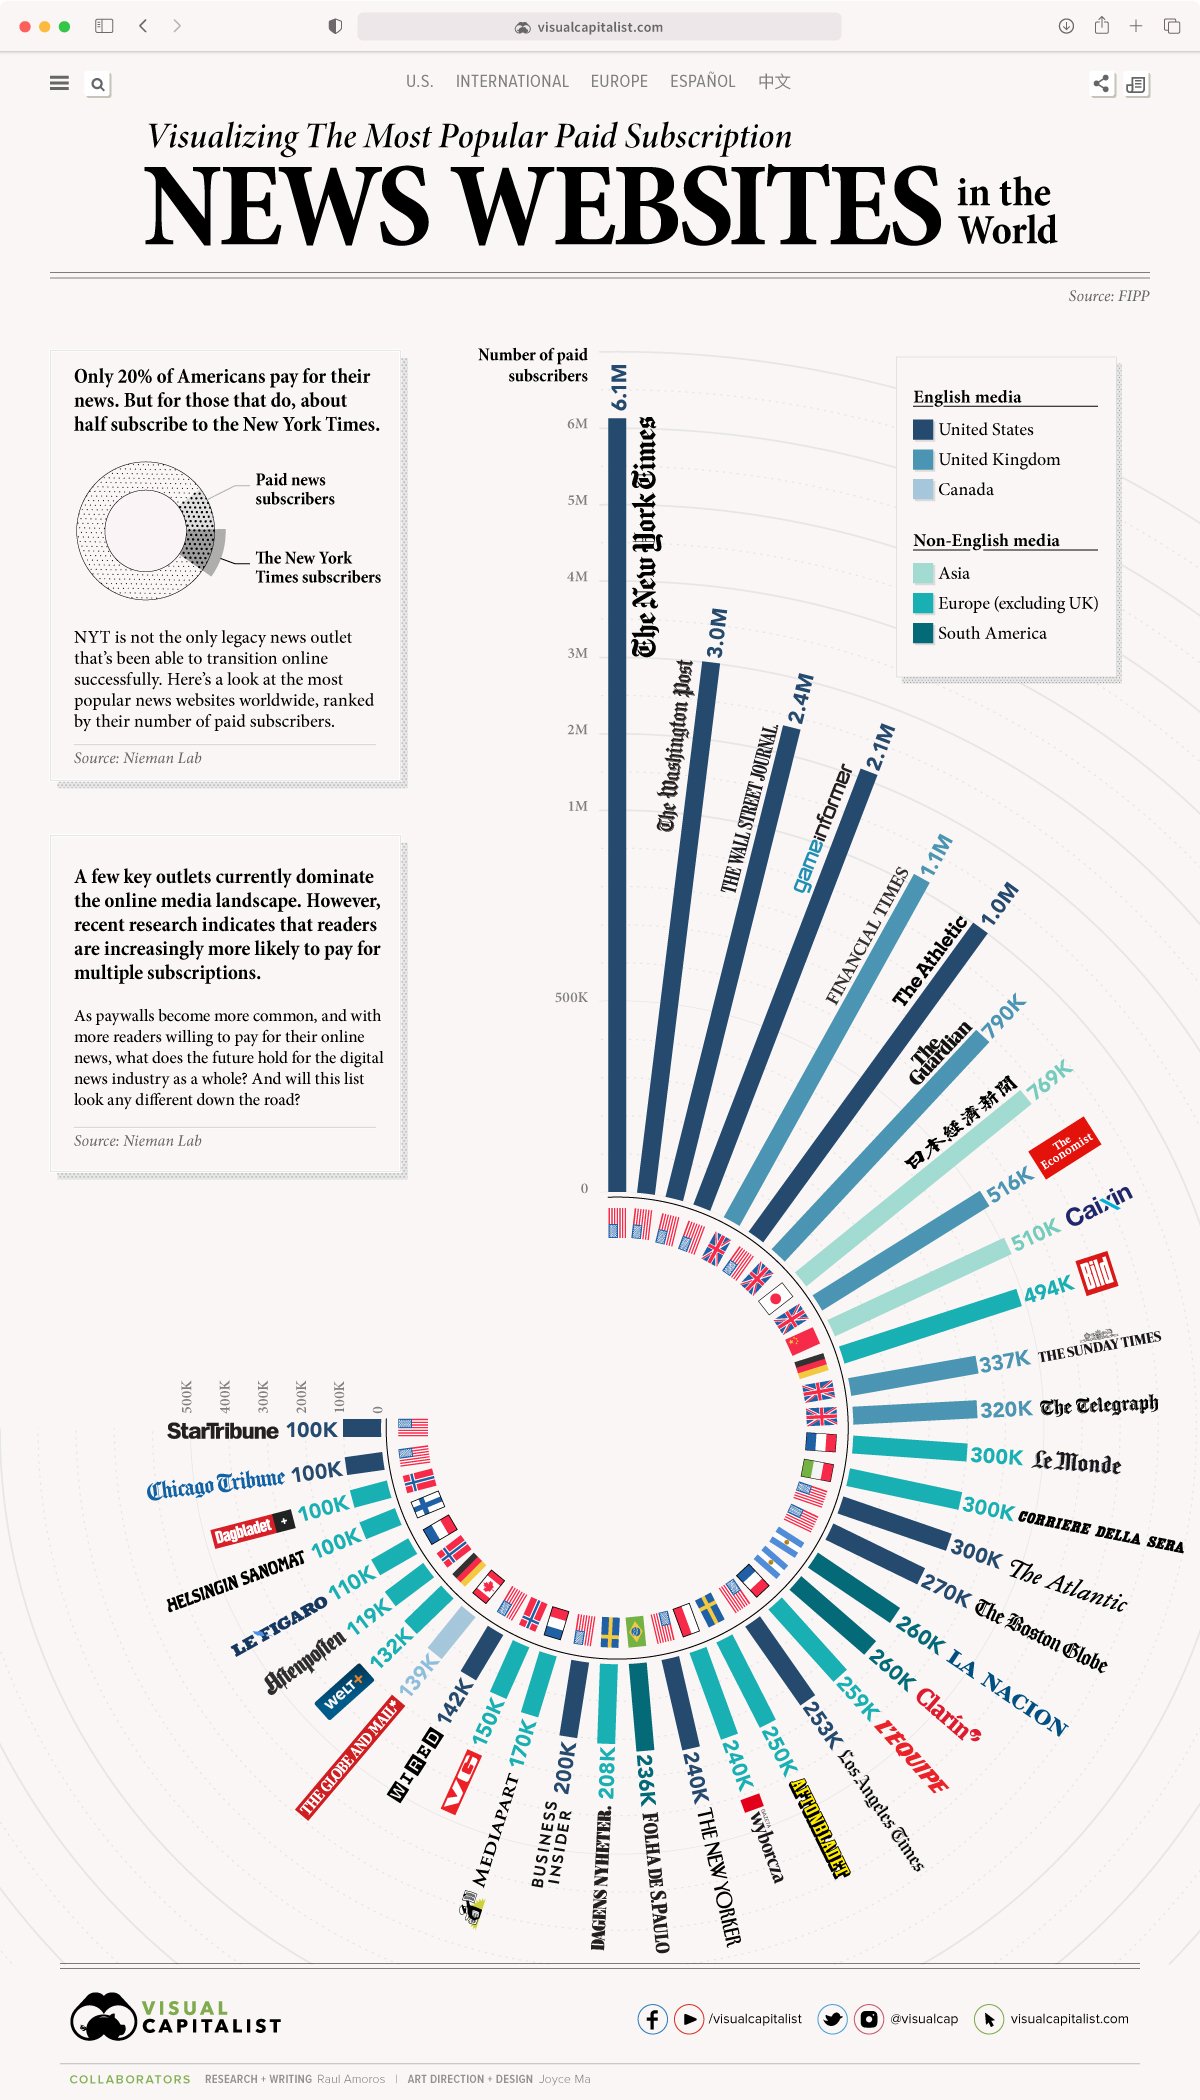
While paywalls are becoming increasingly more popular among news websites, most consumers still aren’t willing to pay for their online news.
In fact, a recent survey by the Reuters Institute for the Study of Journalism reveals that only 20% of Americans pay for digital news, and of those that do, the majority subscribe to only one brand.
This begs the question—which news outlets are audiences willing to pay for?
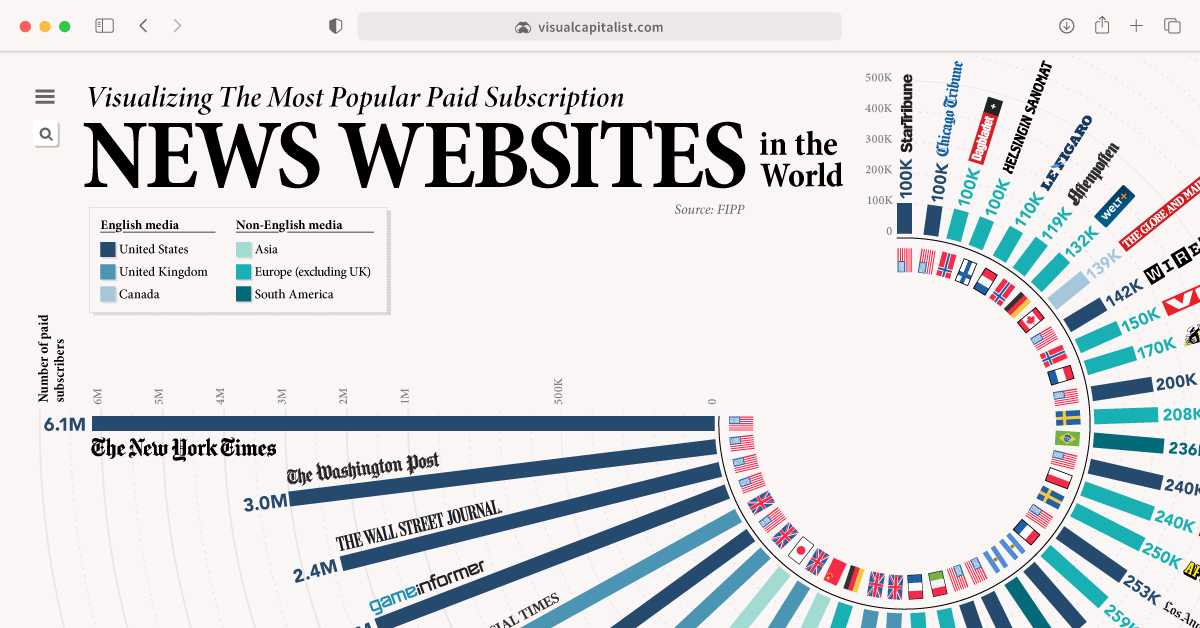
Using data from FIPP and CeleraOne, this graphic looks at the most popular news websites across the globe, based on their total number of paid subscriptions.
*Note: This report relies on publicly available data, and should not be considered an exhaustive list.
The Full Breakdown
With 7.5 million subscriptions, The New York Times (NYT) takes the top spot on the list. 2020 was an exceptionally strong year for the outlet—by Q3 2020, the NYT had generated the same amount of revenue from digital subscriptions as it had for the entire year of 2019.
| Rank | Publication | Paid Subscriptions |
|---|---|---|
| 1 | 🇺🇸 The New York Times | 6,100,000 |
| 2 | 🇺🇸 The Washington Post | 3,000,000 |
| 3 | 🇺🇸 The Wall Street Journal | 2,400,000 |
| 4 | 🇺🇸 Game Informer | 2,100,000 |
| 5 | 🇬🇧 Financial Times | 1,100,000 |
| 6 | 🇺🇸 The Athletic | 1,000,000 |
| 7 | 🇬🇧 The Guardian | 790,000 |
| 8 | 🇯🇵 Nikkei | 769,000 |
| 9 | 🇬🇧 The Economist | 516,000 |
| 10 | 🇨🇳 Caixin | 510,000 |
| 11 | 🇩🇪 Bild | 494,000 |
| 12 | 🇬🇧 The Sunday Times | 337,000 |
| 13 | 🇬🇧 The Telegraph | 320,000 |
| 14 | 🇺🇸 The Atlantic | 300,000 |
| 15 | 🇮🇹 Corriere Della Sera | 300,000 |
| 16 | 🇫🇷 Le Monde | 300,000 |
| 17 | 🇺🇸 The Boston Globe | 270,000 |
| 18 | 🇦🇷 La Nacion | 260,000 |
| 19 | 🇦🇷 Clarin | 260,000 |
| 20 | 🇫🇷 L'equipe | 259,000 |
| 21 | 🇺🇸 Los Angeles Times | 253,000 |
| 22 | 🇸🇪 Aftonbladet | 250,000 |
| 23 | 🇺🇸 The New Yorker | 240,000 |
| 24 | 🇵🇱 Wyborcza | 240,000 |
| 25 | 🇧🇷 Folha de S.Paulo | 236,000 |
| 26 | 🇸🇪 Dagens Nyheter | 208,000 |
| 27 | 🇺🇸 Business Insider | 200,000 |
| 28 | 🇫🇷 Mediapart | 170,000 |
| 29 | 🇳🇴 VG | 150,000 |
| 30 | 🇺🇸 Wired | 142,000 |
| 31 | 🇨🇦 The Globe and Mail | 139,000 |
| 32 | 🇩🇪 Welt | 132,000 |
| 33 | 🇳🇴 Aftenposten | 119,000 |
| 34 | 🇫🇷 Le Figaro | 110,000 |
| 35 | 🇺🇸 Chicago Tribune | 100,000 |
| 36 | 🇺🇸 Star Tribune | 100,000 |
| 37 | 🇳🇴 Dagbladet | 100,000 |
| 38 | 🇫🇮 Helsingin Sanomat | 100,000 |
The Times is the most popular by a landslide—it has over double the number of subscriptions than the second outlet on the list, The Washington Post. Yet, while WaPo is no match for NYT, it still boasts a strong following, with approximately 3 million paid subscriptions as of Q4 2020.
Japanese outlet Nikkei ranks number one among the non-English news websites. It’s the largest business newspaper in Japan, mainly focusing on markets and finance, but also covering politics, sports, and health.
Legacy Papers: Which Websites Come From Traditional Media?
Most of the websites on this list stem from traditional media. Because of this, they’ve had years to establish themselves as trusted sources, and win over loyal readers.
Interestingly, more than half of the outlets included in this ranking are at least 100 years old.
| Publication | Year Launched | Age (Years) |
|---|---|---|
| 🇬🇧 The Guardian | 1821 | 200 |
| 🇬🇧 The Sunday Times | 1821 | 200 |
| 🇫🇷 Le Figaro | 1826 | 195 |
| 🇸🇪 Aftonbladet | 1830 | 190 |
| 🇬🇧 The Economist | 1843 | 178 |
| 🇺🇸 Chicago Tribune | 1847 | 173 |
| 🇺🇸 NYT | 1852 | 169 |
| 🇬🇧 The Telegraph | 1855 | 166 |
| 🇺🇸 The Atlantic | 1857 | 164 |
| 🇳🇴 Aftenposten | 1860 | 160 |
| 🇸🇪 Dagens Nyheter | 1864 | 157 |
| 🇺🇸 Star Tribune | 1867 | 154 |
| 🇳🇴 Dagbladet | 1869 | 152 |
| 🇦🇷 La Nacion | 1870 | 151 |
| 🇺🇸 The Boston Globe | 1872 | 149 |
| 🇮🇹 Corriere Della Sera | 1876 | 145 |
| 🇺🇸 Washington Post | 1877 | 144 |
| 🇯🇵 Nikkei.com | 1876 | 144 |
| 🇺🇸 LA Times | 1881 | 140 |
| 🇬🇧 Financial Times | 1888 | 133 |
| 🇺🇸 Wall Street Journal | 1889 | 132 |
| 🇫🇮 Helsingin Sanomat | 1889 | 132 |
| 🇧🇷 Folha de S.Paulo | 1921 | 100 |
| 🇺🇸 The New Yorker | 1925 | 96 |
| 🇨🇦 The Globe and Mail | 1936 | 85 |
| 🇫🇷 Le Monde | 1944 | 77 |
| 🇦🇷 Clarin | 1945 | 76 |
| 🇳🇴 VG | 1945 | 76 |
| 🇫🇷 L'equipe | 1946 | 75 |
| 🇩🇪 Welt | 1946 | 75 |
| 🇩🇪 Bild | 1952 | 69 |
| 🇵🇱 Wyborcza | 1989 | 32 |
| 🇺🇸 Game Informer | 1991 | 30 |
| 🇺🇸 Wired | 1993 | 28 |
| 🇺🇸 Business Insider | 2007 | 14 |
| 🇫🇷 Mediapart | 2008 | 13 |
| 🇨🇳 Caixin | 2009 | 12 |
| 🇺🇸 The Athletic | 2016 | 5 |
Yet, undeterred by these well-established outlets, a few scrappy websites made the cut despite a shorter history. Four out of the 38 websites are less than 20 years old.
The Athletic is the newest outlet to make the ranking. Established in 2016, the outlet’s target demographic is die-hard sports fans who miss the days of in-depth, quality sports writing.
The Need For Trusted Sources
Amidst the global pandemic, issues involving misinformation and fake news have helped reaffirm the important role that trusted news sources play in the dissemination of public information.
With this in mind, it’ll be interesting to see what the future holds for digital media consumption. With paywalls becoming increasingly more common, will consumers jump on board and eventually be more willing to pay for their news?


Technology
Visualizing AI Patents by Country
See which countries have been granted the most AI patents each year, from 2012 to 2022.


Visualizing AI Patents by Country
This was originally posted on our Voronoi app. Download the app for free on iOS or Android and discover incredible data-driven charts from a variety of trusted sources.
This infographic shows the number of AI-related patents granted each year from 2010 to 2022 (latest data available). These figures come from the Center for Security and Emerging Technology (CSET), accessed via Stanford University’s 2024 AI Index Report.
From this data, we can see that China first overtook the U.S. in 2013. Since then, the country has seen enormous growth in the number of AI patents granted each year.
| Year | China | EU and UK | U.S. | RoW | Global Total |
|---|---|---|---|---|---|
| 2010 | 307 | 137 | 984 | 571 | 1,999 |
| 2011 | 516 | 129 | 980 | 581 | 2,206 |
| 2012 | 926 | 112 | 950 | 660 | 2,648 |
| 2013 | 1,035 | 91 | 970 | 627 | 2,723 |
| 2014 | 1,278 | 97 | 1,078 | 667 | 3,120 |
| 2015 | 1,721 | 110 | 1,135 | 539 | 3,505 |
| 2016 | 1,621 | 128 | 1,298 | 714 | 3,761 |
| 2017 | 2,428 | 144 | 1,489 | 1,075 | 5,136 |
| 2018 | 4,741 | 155 | 1,674 | 1,574 | 8,144 |
| 2019 | 9,530 | 322 | 3,211 | 2,720 | 15,783 |
| 2020 | 13,071 | 406 | 5,441 | 4,455 | 23,373 |
| 2021 | 21,907 | 623 | 8,219 | 7,519 | 38,268 |
| 2022 | 35,315 | 1,173 | 12,077 | 13,699 | 62,264 |
In 2022, China was granted more patents than every other country combined.
While this suggests that the country is very active in researching the field of artificial intelligence, it doesn’t necessarily mean that China is the farthest in terms of capability.
Key Facts About AI Patents
According to CSET, AI patents relate to mathematical relationships and algorithms, which are considered abstract ideas under patent law. They can also have different meaning, depending on where they are filed.
In the U.S., AI patenting is concentrated amongst large companies including IBM, Microsoft, and Google. On the other hand, AI patenting in China is more distributed across government organizations, universities, and tech firms (e.g. Tencent).
In terms of focus area, China’s patents are typically related to computer vision, a field of AI that enables computers and systems to interpret visual data and inputs. Meanwhile America’s efforts are more evenly distributed across research fields.
Learn More About AI From Visual Capitalist
If you want to see more data visualizations on artificial intelligence, check out this graphic that shows which job departments will be impacted by AI the most.

-

 Markets1 week ago
U.S. Debt Interest Payments Reach $1 Trillion
-

 Business2 weeks ago
Charted: Big Four Market Share by S&P 500 Audits
-

 Real Estate2 weeks ago
Ranked: The Most Valuable Housing Markets in America
-

 Money2 weeks ago
Which States Have the Highest Minimum Wage in America?
-

 AI2 weeks ago
Ranked: Semiconductor Companies by Industry Revenue Share
-

 Markets2 weeks ago
Ranked: The World’s Top Flight Routes, by Revenue
-

 Demographics2 weeks ago
Population Projections: The World’s 6 Largest Countries in 2075
-

 Markets2 weeks ago
The Top 10 States by Real GDP Growth in 2023