Technology
Ranked: The Most Popular Paid Subscription News Websites


Ranked: The Most Popular Subscription News Websites
While paywalls are becoming increasingly more popular among news websites, most consumers still aren’t willing to pay for their online news.
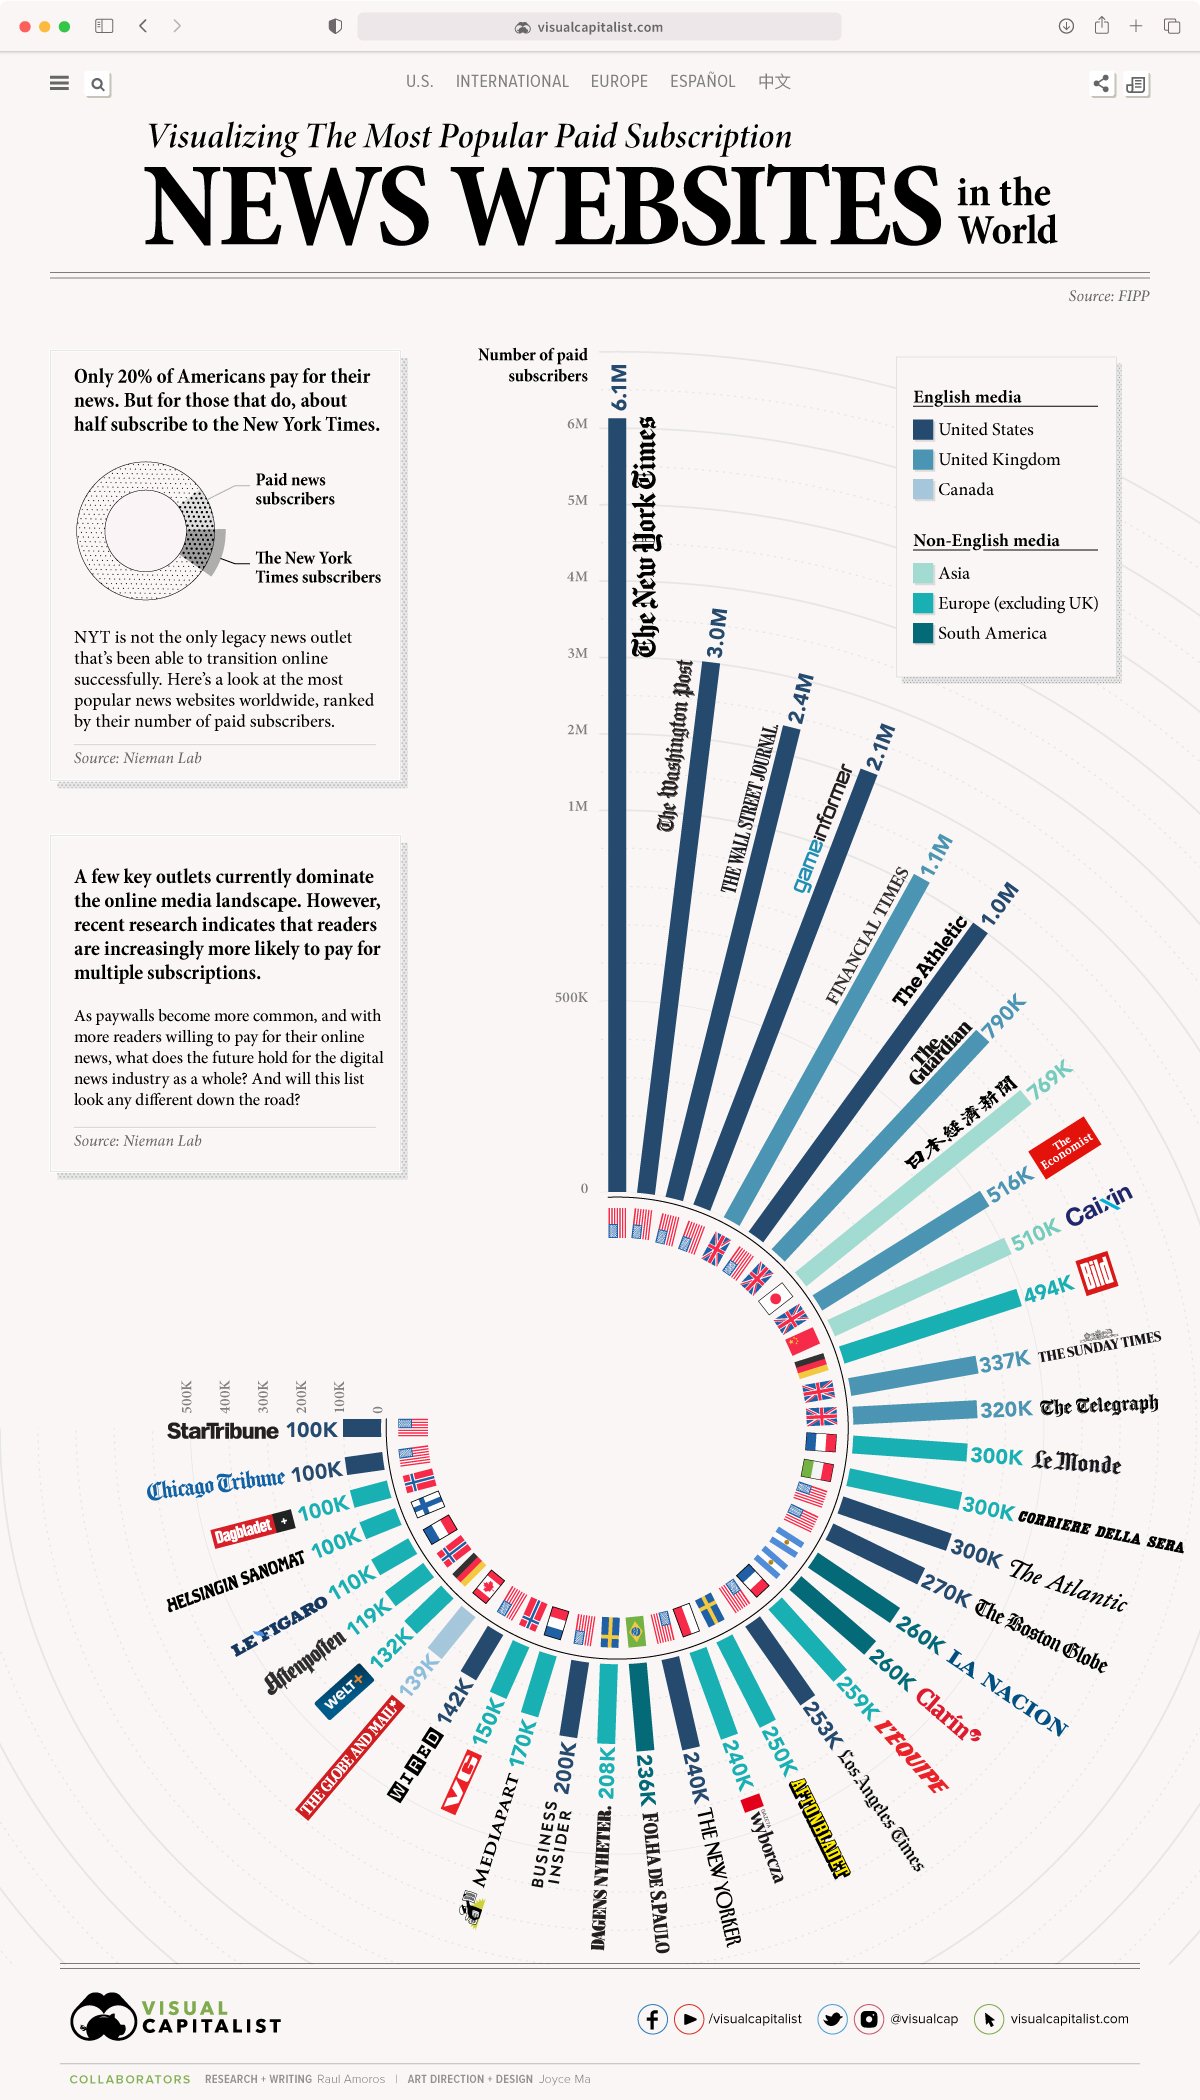
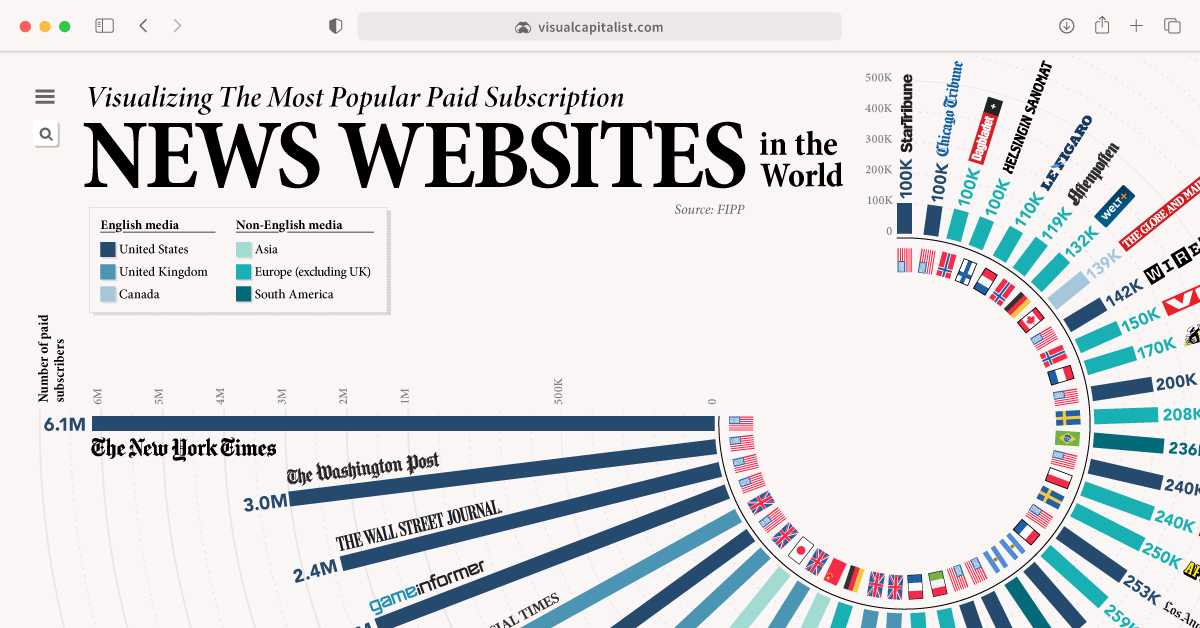
In fact, a recent survey by the Reuters Institute for the Study of Journalism reveals that only 20% of Americans pay for digital news, and of those that do, the majority subscribe to only one brand.
This begs the question—which news outlets are audiences willing to pay for?
Using data from FIPP and CeleraOne, this graphic looks at the most popular news websites across the globe, based on their total number of paid subscriptions.
*Note: This report relies on publicly available data, and should not be considered an exhaustive list.
The Full Breakdown
With 7.5 million subscriptions, The New York Times (NYT) takes the top spot on the list. 2020 was an exceptionally strong year for the outlet—by Q3 2020, the NYT had generated the same amount of revenue from digital subscriptions as it had for the entire year of 2019.
| Rank | Publication | Paid Subscriptions |
|---|---|---|
| 1 | 🇺🇸 The New York Times | 6,100,000 |
| 2 | 🇺🇸 The Washington Post | 3,000,000 |
| 3 | 🇺🇸 The Wall Street Journal | 2,400,000 |
| 4 | 🇺🇸 Game Informer | 2,100,000 |
| 5 | 🇬🇧 Financial Times | 1,100,000 |
| 6 | 🇺🇸 The Athletic | 1,000,000 |
| 7 | 🇬🇧 The Guardian | 790,000 |
| 8 | 🇯🇵 Nikkei | 769,000 |
| 9 | 🇬🇧 The Economist | 516,000 |
| 10 | 🇨🇳 Caixin | 510,000 |
| 11 | 🇩🇪 Bild | 494,000 |
| 12 | 🇬🇧 The Sunday Times | 337,000 |
| 13 | 🇬🇧 The Telegraph | 320,000 |
| 14 | 🇺🇸 The Atlantic | 300,000 |
| 15 | 🇮🇹 Corriere Della Sera | 300,000 |
| 16 | 🇫🇷 Le Monde | 300,000 |
| 17 | 🇺🇸 The Boston Globe | 270,000 |
| 18 | 🇦🇷 La Nacion | 260,000 |
| 19 | 🇦🇷 Clarin | 260,000 |
| 20 | 🇫🇷 L'equipe | 259,000 |
| 21 | 🇺🇸 Los Angeles Times | 253,000 |
| 22 | 🇸🇪 Aftonbladet | 250,000 |
| 23 | 🇺🇸 The New Yorker | 240,000 |
| 24 | 🇵🇱 Wyborcza | 240,000 |
| 25 | 🇧🇷 Folha de S.Paulo | 236,000 |
| 26 | 🇸🇪 Dagens Nyheter | 208,000 |
| 27 | 🇺🇸 Business Insider | 200,000 |
| 28 | 🇫🇷 Mediapart | 170,000 |
| 29 | 🇳🇴 VG | 150,000 |
| 30 | 🇺🇸 Wired | 142,000 |
| 31 | 🇨🇦 The Globe and Mail | 139,000 |
| 32 | 🇩🇪 Welt | 132,000 |
| 33 | 🇳🇴 Aftenposten | 119,000 |
| 34 | 🇫🇷 Le Figaro | 110,000 |
| 35 | 🇺🇸 Chicago Tribune | 100,000 |
| 36 | 🇺🇸 Star Tribune | 100,000 |
| 37 | 🇳🇴 Dagbladet | 100,000 |
| 38 | 🇫🇮 Helsingin Sanomat | 100,000 |
The Times is the most popular by a landslide—it has over double the number of subscriptions than the second outlet on the list, The Washington Post. Yet, while WaPo is no match for NYT, it still boasts a strong following, with approximately 3 million paid subscriptions as of Q4 2020.
Japanese outlet Nikkei ranks number one among the non-English news websites. It’s the largest business newspaper in Japan, mainly focusing on markets and finance, but also covering politics, sports, and health.
Legacy Papers: Which Websites Come From Traditional Media?
Most of the websites on this list stem from traditional media. Because of this, they’ve had years to establish themselves as trusted sources, and win over loyal readers.
Interestingly, more than half of the outlets included in this ranking are at least 100 years old.
| Publication | Year Launched | Age (Years) |
|---|---|---|
| 🇬🇧 The Guardian | 1821 | 200 |
| 🇬🇧 The Sunday Times | 1821 | 200 |
| 🇫🇷 Le Figaro | 1826 | 195 |
| 🇸🇪 Aftonbladet | 1830 | 190 |
| 🇬🇧 The Economist | 1843 | 178 |
| 🇺🇸 Chicago Tribune | 1847 | 173 |
| 🇺🇸 NYT | 1852 | 169 |
| 🇬🇧 The Telegraph | 1855 | 166 |
| 🇺🇸 The Atlantic | 1857 | 164 |
| 🇳🇴 Aftenposten | 1860 | 160 |
| 🇸🇪 Dagens Nyheter | 1864 | 157 |
| 🇺🇸 Star Tribune | 1867 | 154 |
| 🇳🇴 Dagbladet | 1869 | 152 |
| 🇦🇷 La Nacion | 1870 | 151 |
| 🇺🇸 The Boston Globe | 1872 | 149 |
| 🇮🇹 Corriere Della Sera | 1876 | 145 |
| 🇺🇸 Washington Post | 1877 | 144 |
| 🇯🇵 Nikkei.com | 1876 | 144 |
| 🇺🇸 LA Times | 1881 | 140 |
| 🇬🇧 Financial Times | 1888 | 133 |
| 🇺🇸 Wall Street Journal | 1889 | 132 |
| 🇫🇮 Helsingin Sanomat | 1889 | 132 |
| 🇧🇷 Folha de S.Paulo | 1921 | 100 |
| 🇺🇸 The New Yorker | 1925 | 96 |
| 🇨🇦 The Globe and Mail | 1936 | 85 |
| 🇫🇷 Le Monde | 1944 | 77 |
| 🇦🇷 Clarin | 1945 | 76 |
| 🇳🇴 VG | 1945 | 76 |
| 🇫🇷 L'equipe | 1946 | 75 |
| 🇩🇪 Welt | 1946 | 75 |
| 🇩🇪 Bild | 1952 | 69 |
| 🇵🇱 Wyborcza | 1989 | 32 |
| 🇺🇸 Game Informer | 1991 | 30 |
| 🇺🇸 Wired | 1993 | 28 |
| 🇺🇸 Business Insider | 2007 | 14 |
| 🇫🇷 Mediapart | 2008 | 13 |
| 🇨🇳 Caixin | 2009 | 12 |
| 🇺🇸 The Athletic | 2016 | 5 |
Yet, undeterred by these well-established outlets, a few scrappy websites made the cut despite a shorter history. Four out of the 38 websites are less than 20 years old.
The Athletic is the newest outlet to make the ranking. Established in 2016, the outlet’s target demographic is die-hard sports fans who miss the days of in-depth, quality sports writing.
The Need For Trusted Sources
Amidst the global pandemic, issues involving misinformation and fake news have helped reaffirm the important role that trusted news sources play in the dissemination of public information.
With this in mind, it’ll be interesting to see what the future holds for digital media consumption. With paywalls becoming increasingly more common, will consumers jump on board and eventually be more willing to pay for their news?


Technology
Ranked: Semiconductor Companies by Industry Revenue Share
Nvidia is coming for Intel’s crown. Samsung is losing ground. AI is transforming the space. We break down revenue for semiconductor companies.


Semiconductor Companies by Industry Revenue Share
This was originally posted on our Voronoi app. Download the app for free on Apple or Android and discover incredible data-driven charts from a variety of trusted sources.
Did you know that some computer chips are now retailing for the price of a new BMW?
As computers invade nearly every sphere of life, so too have the chips that power them, raising the revenues of the businesses dedicated to designing them.
But how did various chipmakers measure against each other last year?
We rank the biggest semiconductor companies by their percentage share of the industry’s revenues in 2023, using data from Omdia research.
Which Chip Company Made the Most Money in 2023?
Market leader and industry-defining veteran Intel still holds the crown for the most revenue in the sector, crossing $50 billion in 2023, or 10% of the broader industry’s topline.
All is not well at Intel, however, with the company’s stock price down over 20% year-to-date after it revealed billion-dollar losses in its foundry business.
| Rank | Company | 2023 Revenue | % of Industry Revenue |
|---|---|---|---|
| 1 | Intel | $51B | 9.4% |
| 2 | NVIDIA | $49B | 9.0% |
| 3 | Samsung Electronics | $44B | 8.1% |
| 4 | Qualcomm | $31B | 5.7% |
| 5 | Broadcom | $28B | 5.2% |
| 6 | SK Hynix | $24B | 4.4% |
| 7 | AMD | $22B | 4.1% |
| 8 | Apple | $19B | 3.4% |
| 9 | Infineon Tech | $17B | 3.2% |
| 10 | STMicroelectronics | $17B | 3.2% |
| 11 | Texas Instruments | $17B | 3.1% |
| 12 | Micron Technology | $16B | 2.9% |
| 13 | MediaTek | $14B | 2.6% |
| 14 | NXP | $13B | 2.4% |
| 15 | Analog Devices | $12B | 2.2% |
| 16 | Renesas Electronics Corporation | $11B | 1.9% |
| 17 | Sony Semiconductor Solutions Corporation | $10B | 1.9% |
| 18 | Microchip Technology | $8B | 1.5% |
| 19 | Onsemi | $8B | 1.4% |
| 20 | KIOXIA Corporation | $7B | 1.3% |
| N/A | Others | $126B | 23.2% |
| N/A | Total | $545B | 100% |
Note: Figures are rounded. Totals and percentages may not sum to 100.
Meanwhile, Nvidia is very close to overtaking Intel, after declaring $49 billion of topline revenue for 2023. This is more than double its 2022 revenue ($21 billion), increasing its share of industry revenues to 9%.
Nvidia’s meteoric rise has gotten a huge thumbs-up from investors. It became a trillion dollar stock last year, and broke the single-day gain record for market capitalization this year.
Other chipmakers haven’t been as successful. Out of the top 20 semiconductor companies by revenue, 12 did not match their 2022 revenues, including big names like Intel, Samsung, and AMD.
The Many Different Types of Chipmakers
All of these companies may belong to the same industry, but they don’t focus on the same niche.
According to Investopedia, there are four major types of chips, depending on their functionality: microprocessors, memory chips, standard chips, and complex systems on a chip.
Nvidia’s core business was once GPUs for computers (graphics processing units), but in recent years this has drastically shifted towards microprocessors for analytics and AI.
These specialized chips seem to be where the majority of growth is occurring within the sector. For example, companies that are largely in the memory segment—Samsung, SK Hynix, and Micron Technology—saw peak revenues in the mid-2010s.

-

 Mining2 weeks ago
Charted: The Value Gap Between the Gold Price and Gold Miners
-

 Real Estate1 week ago
Ranked: The Most Valuable Housing Markets in America
-

 Business1 week ago
Charted: Big Four Market Share by S&P 500 Audits
-

 AI1 week ago
The Stock Performance of U.S. Chipmakers So Far in 2024
-

 Misc1 week ago
Almost Every EV Stock is Down After Q1 2024
-

 Money2 weeks ago
Where Does One U.S. Tax Dollar Go?
-

 Green2 weeks ago
Ranked: Top Countries by Total Forest Loss Since 2001
-

 Real Estate2 weeks ago
Visualizing America’s Shortage of Affordable Homes